Freimaurer, Illuminaten, Rosenkreuzer, Jesuiten, Alchemisten, Mesmeristen… — die verloren gegangene Bibliothek des letzten illuminatischen Ordensprovinzials

Johann Joachim Christoph Bode starb am 13. Dezember 1793, zwei Stunden vor Mitternacht – wohl an den Folgen der Zahn- und Kieferentzündungen, die ihm seit Jahren mit Anfällen von „Flußfieber und Zahnschmerzen” zu schaffen machten. Damit kam in Gang, was 1787/88 entschieden worden war.

Im Herbst 1787 hatte Bode von Weimar aus wieder einmal Gotha besucht. Seine Arbeit des letzten halben Jahrzehnts lag in Trümmern. Noch im Sommer hatte er sich in Paris bemüht, die Illuminaten aus der Schusslinie zu ziehen: „Philadelphen“ sollten sie in Zukunft, und damit endlich wieder geheim, heißen. Seit 1785 war mit „Illuminaten“ kein Geheimnis mehr zu machen. Bayerns Staat hatte alle Geheimorden und insbesondere diesen verboten. Bode hatte dessen ungeachtet als Provinzial „Ioniens“, Obersachsens, weiterhin Mitglieder aufgenommen. Niemand konnte schließlich wissen, ob es diese bayerischen Illuminaten wirklich gab. Doch die Publikationen Weishaupts hatten dann 1786 zunehmend alle interessanten Karten auf den Tisch gelegt. Die von Weishaupt publizierten Gradschriften offenbarten gerade das, was Mitgliedern auf dem Weg in das Geheimnis des Ordens erst entdeckt werden sollte. Während Bode im Sommer 1787 in Paris war, hatte, vollendet verheerend, der bayerische Staat nachgelegt und nun Weishaupt mit seinen Mitstreitern durch zwei Bände von Offenlegungen konfiszierter Akten persönlich diskreditiert.

Der Orden war im Herbst 1787 tot. Zuviel war jetzt publiziert. Für Bode war die Zeit gekommen, aus den eigenen Akten die Dinge richtigzustellen – so lautete wohl sein Vorschlag 1787 gegenüber Ernst II., dem Gothaer Herzog. Dieser, in der Hierarchie als „deutscher National“ eine Stufe über ihm, verbat jede weitere Publikation. Der Orden hatte seinen Mitgliedern Diskretion abverlangt und war diese ihnen im Gegenzug schuldig. Im März 1788 machte Ernst II. auf Besuch in Weimar die Sache mit Bode perfekt: Der Regent würde dem Provinzial das gesamte illuminatische Archiv für 1500 Reichsthaler abkaufen. Die Transaktion würde nach Bodes Tode stattfinden und ihm eine Geldsumme bescheren, über die er jetzt schon testamentarisch verfügen konnte. Bode notierte mit Zerknirschung Ende März im Tagebuch:

29 u 30. Daran gearbeitet meine Briefe, und auch die Ordenspapiere in eine erträgliche Ordnung zu bringen. Wolle nur der Himmel, daß diese Arbeit nicht dadurch vergebens gemacht werde, daß ihr künftiger Besitzer der Herzog von Gotha, solche dem Publikum vorenthält. [full transcript]

Genau darum ging es Ernst: diese Papiere dauerhaft der Nachwelt zu entziehen, wenn auch nicht schon zu vernichten.

Am 14. Dezember 1793 übermittelte Christian Gottlob von Voigt die Nachricht von Bodes Tod nach Gotha. Als Nachlassverwalter übernahm er die Inventarisierung des Bestandes und erfasste dabei nicht nur Freimaurer- und Illuminatenakten, sondern auch Bodes einschlägige Bibliothek.


Q400894

Bodes geheime Privatbibliothek

Aus Bodes freimaurerischen und illuminatischen Akten wurde im Zuge der Ereignisse, die am 14. Dezember 1793 in Gang kamen, die „Schwedenkiste“ – jener Aktenbestand, der seit den 1990er Jahren Forscher auf sich zieht, weil hier weitgehend konsistent die ganze interne Dokumentation der letzten funktionierenden Ordensprovinz vorliegt. Die Geschichte der Akten ist verwickelt: Ernst II. hielt Wort; Bodes freimaurerischer Nachlass ging an im Gegenzug für die versprochenen 1500 Reichsthaler an den Herzog. Zwei Kisten wurden am 13. Januar 1794 von Heinrich August Ottokar Reichard in Weimar übernommen und nach Gotha überführt, wo sie dann erst einmal auf ein Jahrzehnt verschlossen blieben. Erst mit dem Tod Ernst II., 1804, wurden diese Kisten geöffnet, nun, um aus Ernsts Besitz noch Bücher hinzuzufügen: spektakuläre esoterische und alchemistische Handschriften, mit denen Ernst nicht mehr in Verbindung gebracht werden wollte. Nicht alles passte in Bodes zwei Kisten. Zielort der drei Kisten, die man wenig später auf die Reise schickte, war das Archiv der Schwedischen Großloge in Stockholm.

Als 1880/81 Gothas Loge diesen Bestand zurückforderte, sollte nur eine Kiste zurückkommen – die „Schwedenkiste“, in deren Zentrum seitdem die illuminatische Buchführung der Provinz Ioniens steht.

Bodes und Ernsts Bibliotheken blieben in Stockholm. Diejenige Bodes lässt sich dabei dank von Voigts Inventar weitaus präziser vermessen als die Ernsts. Das Inventar, das wir als einfache PDF mitliefern liegt noch immer im Archiv der schwedischen Großloge in Stockholm. Die obskure Bibliothek Ernsts II. ist dagegen erst einmal ein Rätsel. Sie reiste unkatalogisiert und wurde dem Logenbesitz ohne weitere Kennzeichnung einverleibt, doch lässt sich auch sie in Umrissen skizzieren; sie liegt heute vor allem unter den Signaturgruppen Tyskland und Esoterica in Stockholms Logenarchiv, wie wir seit einer Forschungsreise 2019 wissen.

Im Folgenden geht es mir ausschließlich um Bodes Bibliothek, die sich dank des Inventars und dank der Tatsache, dass hier vor allem Druckschriften zu notieren sind (keine unikalen Prachthandschriften), relativ leicht in effige nachbilden lässt.

Julia Mös erfasste im Projekt der Arbeitsstelle Illuminatenforschung am Forschungszentrum Gotha die Titel dieses Inventars und legte dabei einen ersten Abgleich mit in öffentlichen Bibliotheken katalogisierten Ausgaben vor. Dieser liegt hiermit in Datenbankobjekten vor, die sich jetzt beliebig vernetzen lassen.

Auf die bibliographischen Kerndaten in Form von bereits durchgeführten Datenbankvernetzungen verzichteten wir zugunsten einer extensiven Katalogverortung, über die man all diese Angaben theoretisch jederzeit in einer Datenbankabfrage erhalten könnte. Die Verlinkung mit PPN-Nummern sowie VD16, VD17 und VD18 Signaturen dient vor allem der Identifikation der Auflagen. Digitalisate können wir im selben Moment auf dem kürzesten Weg mit den Datenbankobjekten verfügbar machen, wenn auch nicht solche der Stockholmer Exemplare.

Einige Worte zu Bodes Bibliothek.

Von Voigts Liste ist in sechs Zählungen untergliedert; die ersten drei bilden dabei einen engeren Zusammenhang als freimaurerische Schriften:

  1. Freimaurer Schrifften [278 Einträge]
  2. Freimaurer Reden [75 Einträge]
  3. Freimaurer Gedichte [48 Einträge]
  4. Rosenkreutzer [161 Einträge]
  5. Jesuiten [68 Einträge]
  6. Magnetismus [16 Einträge]

Es ist unklar, ob Bode die Kategorien selbst so betitelte. Die Sektion „Rosenkreuzer“ umfasst Alchemie im breiten Spektrum. Unter den Jesuitica findet sich vor allem Religion, die aus einer lutherisch orthodoxen Grundposition gefährlich anmutet; die Herrenhuter fallen dabei mitten unter die Jesuiten. Bei den Schriften zum Magnetismus geht es natürlich nicht um klassische Physik, sondern um die aktuellen Theorien zum „animalischen Magnetismus“, um Theorien zum „magnetischen Fluidum“, um spektakuläre Heilungen, in denen Mesmeristen, „Somnambule“ und Patientinnen im Zentrum stehen. Unsere Version notiert zwar die Nummern mit den Rubriken, zählt jedoch daneben unabhängig von 1 bis 763 – eine Zählung, die Einzelbänden eigenen Rang gibt, wo Bode mit Kleinbuchstaben untergliederte (seine originale Zählung ist jedoch als Inventar-Nummer laufend mitgegeben).

Die folgende Suche gibt die Liste von Voigts in ihrer Organisation wieder und nützt bei allem Weiteren als Basissuche:

Alle komplexeren Listen werden länger, wo immer es mehrere Einträge auf eine einzelne Anfrage gibt – etwa mehrere zu nennende Digitalisate. Die Mehrfachaussagen sind jeweils in weiteren Zeilen zur selben Q-Nummer des Objektes notiert. Die nachfolgende Suche bietet die Auflagen, Publikationsorte, Publikationsdaten, ihre Nachweise in Katalogen, verfügbare Digitalisate. Praktisch ist sie vor allem, um über sie direkten Zugriff auf Digitalisate nehmen lässt.

Die Suchen lassen sich (am rechten Rand das Menü dazu) editieren, so dass man Fragestellungen in immer weiteren Spalten erweitern kann. Die Datenbank erlaubt im selben Moment Suchen, die über die gängigen hinausgehen.

Bode übersetzte beruflich, er reiste zwei mal nach Paris in freimaurerischer Mission, seine Bibliothek erweist sich als entsprechend international aufgestellt:

Interessantester ist die chronologische Distribution der Bibliothek. Sie macht sichtbar, was bereits die Erfahrung beim Durchblättern des Inventars ist: Bode kaufte vor allem aktuelle Bücher. Den Spitzenwert nimmt dabei das Jahr 1787 ein. Der letzte Titel stammt aus dem Jahr seines Todes, 1793. Hier der Bestand jahrzehntweise nach Publikationsjahren und nach Bodes Rubriken aufgeschlüsselt:

Alte Titel finden sich besonders im Feld der Rosenkreuzerischen Schriften – ein Indiz dafür, dass Bode hier weit über die Feindbeobachtung hinausging. Alchemie beschäftigte ihn offensichtlich längst als Curiosum mit dem Interesse, Obskures der letzten Jahrhunderte aufzutreiben. Goethes Faust steigt in diese Ära hinab. Kostbarer und weitaus auffälliger sind in diesem esoterisch-alchemistischen Feld indes die Titel, die in Stockholm Ernst II. zuzuordnen sein dürften: Prachthandschriften, die im 18. Jahrhundert in den jeweiligen Zirkeln als Geheimschriften – abseits des Druckmarktes – kursierten. Hier scheinen sich Ernst II. und Bode als Buchliebhaber begegnet zu sein. Aus der brieflichen Korrespondenz wird zuweilen ersichtlich, dass Bode gezielt auf Reisen sammelte und davon Ernst in Kenntnis setzte – vielleicht als Abnehmer besonders kostbarer Stücke. Hier Bodes gesamte Bibliothek chronologisch geordnet, die undatierten Titel stehen dabei zu Anfang:

To do

Vieles ist für uns im Moment experimentelles Gelände. Auf den ersten Blick fehlt uns eine Suchschablone wie Bibliotheken sie verwenden. Vor allem fehlt uns die bibliothekarische Expertise, mit der über die von uns erfassten PPN- und VD-Nummern unseren Items Metadaten aus Bibliotheksdatenbanken zuordnen könnten.

Unsere Liste macht vorerst vor allem den interaktiven Umgang mit der unbekannten Bibliothek möglich. Es ist von hier aus vergleichsweise leicht, Vernetzungen in ganz beliebigen weiterführenden jeweiligen Forschungsinteressen vorzunehmen. Wer über ein Konto verfügt, kann mit dieser Liste, sich zwischen Digitalisaten fortbewegend, Verknüpfungen vornehmen – andere Digitalisate notieren, Themen verschlagworten, Bibliotheksstandorte festhalten, Titel vernetzen, etwa mit Verlagen oder zeitgenössischen Rezensionen. Vor allem lassen sich mit dem eigenen Nutzerkonto im Abgleich mit von Voigts Inventar und den Beständen im Stockholmer Archiv Korrekturen vornehmen – ohne den Umweg einer Email an „die Herausgeber“ dieser Liste. Unser Interesse ist es hier vor allem, die Materialgrundlagen für Fachleute möglichst direkt bearbeitbar zu machen.

Spannend sind für uns dabei insbesondere technisch versierte Materialerschließungen, Materialanalysen, zu denen Fachleute mit Data-Mining und in komplexeren Visualisierungen in der Lage sind.

Das konkretere Ziel dieser Arbeit bleibt die Erschließung der gesamten Materiallage, in der sich die Bibliothek Bodes verhedderte: Sie gelangte in das Gefüge der Materialien, die hier mitsamt den Illuminatenakten aus der öffentlichen Wahrnehmung gerieten. Wir stehen hier vor einer spannende Bibliothek, der eines Marktinsiders, wenn man die Welt der freimaurerischen und konkurrierenden Verbindungen einmal als Markt erfassen will. Bode bewegte sich auf diesem Markt genussvoll und mit enormer Neugier bis an sein Lebensende. Wir begegnen hier zudem einer Bibliothek der persönlichen Beobachtungen – es finden sich unter den Autoren und unter den Betroffenen der Bücher Menschen, mit denen Bode in Austausch stand. Eine interessante Durchdringung wird Bodes Kontaktnetz mit diesem Informationspool abgleichen, irgendwann in der Zukunft. Im Moment ist es schon interessant genug, dass wir auf diese Weise, dank der fortscheitenden Digitalisierung der frühmodernen Buchproduktion nun vom Schreibtisch Bibliotheken wie diese rekonstruieren und durchstöbern können.


PS. Mein besonderer Dank an Bruno Belhoste für das Skript zur Profilierung der Bibliothek.
PS2. Die Liste wurde Mitte Oktober 2022 abgeglichen mit einer Liste Reinhard Markners, die dieser im Archiv der Schwedischen Großloge anfertigte, und die im Zuge des Abgleichs Stockholmer alte und neue Signaturen erhielt.
Imagine a Graph Query Helper for Graph Databases

[Link für Deutsche Übersetzung]

FactGrid is a graph database. If you run searches in such a database you should rather not think of a resource filled with interrelated tables (of people, places, organizations, documents…) – but of something more spatial, more geometric, more graphic.

Think of your own knowledge. You will not be able to give a table of all the names that have a meaning in your knowledge, or of all the places related to these names. Our knowledge is more like a web of interrelated objects. Nicolaus Copernicus? He is the man who wrote De revolutionibus. What else do you know? Maybe that he was born in Thorn, Polish Toruń, and that he studied at the Universities of Padua and Bolognia. I at least do not immediately know much more about the author who brought about the “Copernican Revolution”. That, of course, is an object that rings many more bells, with all the connections to other items of knowledge it has in my knowledge. I can add that these two universities were good places to study those subjects that were to become the natural sciences – but that again is knowledge on these objects, not on Copernicus, knowldge that got stuck in my knowledge as it added some more colour to my knowledge about Copernicus, the person. Think of interrelated objects hanging together in the wider mesh of your knowledge – of objects that link to each other like atoms in a molecule.

…an object with links to two other objects? That could be someone linked to her two parents. The graph would not look different if that was another person with his two daughters, or Copernicus with links to the two universities mentioned. Well, Copernicus studied at four universities, to be precise – but that is not the problem.

The problem is that the molecular model does not carry particularly well as it puts all the differences into the atoms, hence the various colours in images and the different connectivities of atoms in the typical three dimensional tool kits. In a database like FactGrid all the objects are structurally completely identical. They all are just “Items”: meaningless points, “nodes”, under Q-numbers counted up from 1 to infinity. The various and very specific Properties between the objects make all the differences in a graph database: “Fathers” are in FactGrid Items that have P141 “father” properties referring to them; mothers have P142 Properties linking from other items towards them.

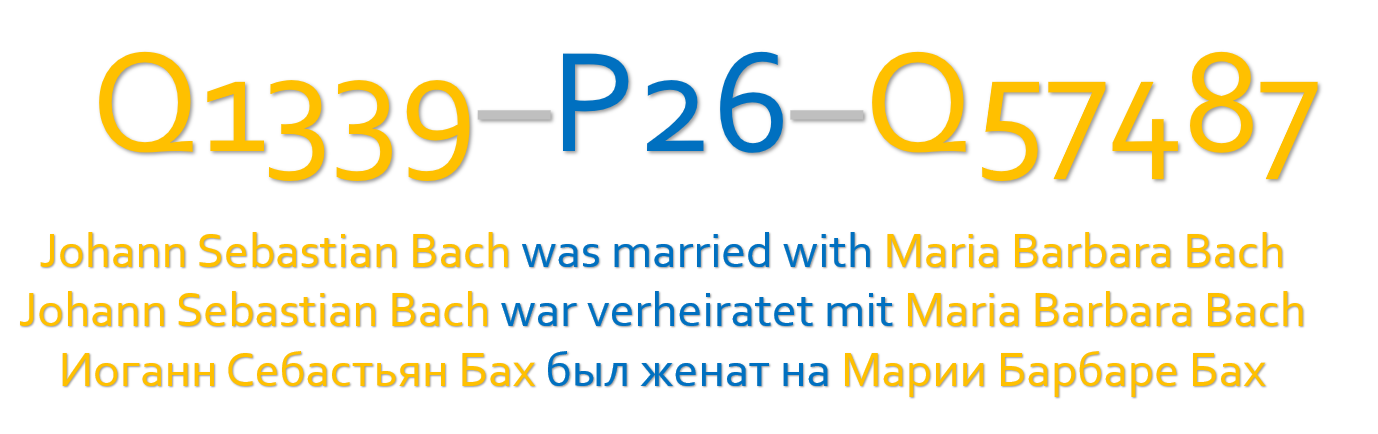
In a triple-based database (which breaks down all knowledge into three-part statements) we will need no more than two sorts of components: You can take spheres for the objects of our knowledge, the “Items”, and arrows for the links that run between them – arrows as we have to express directions in the various statements.

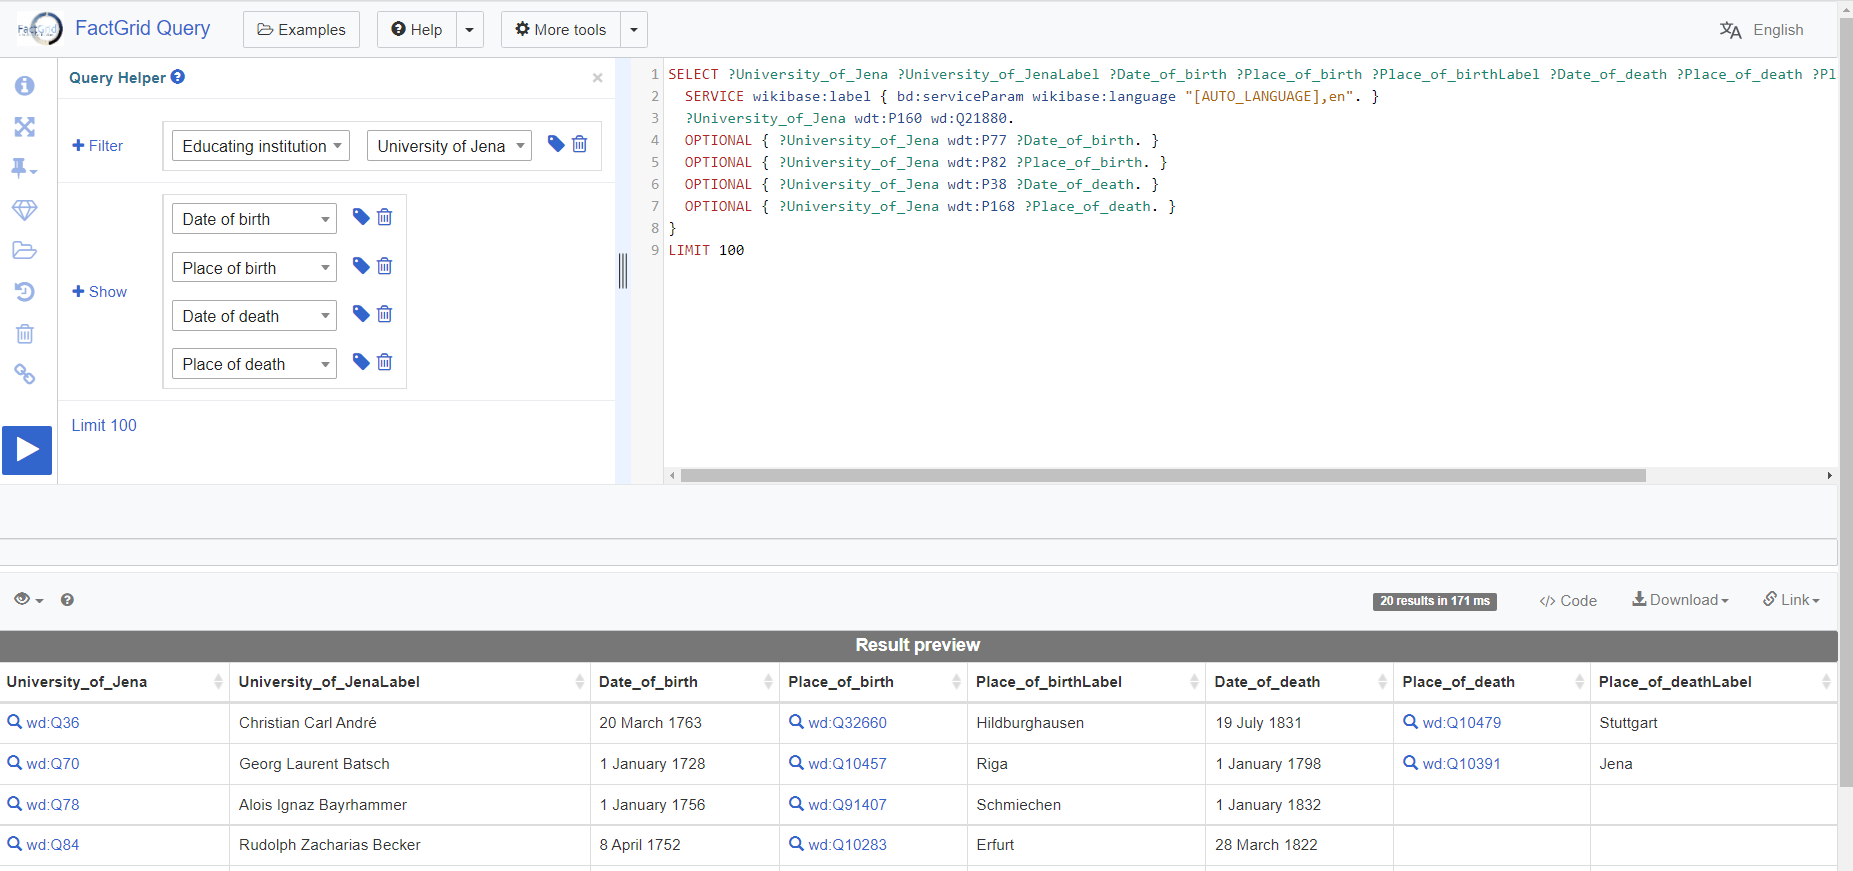
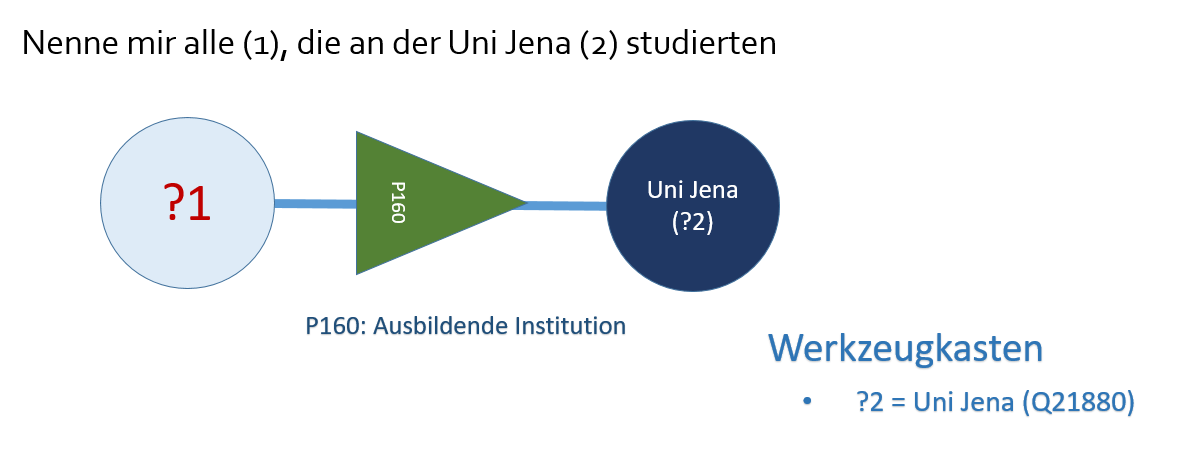
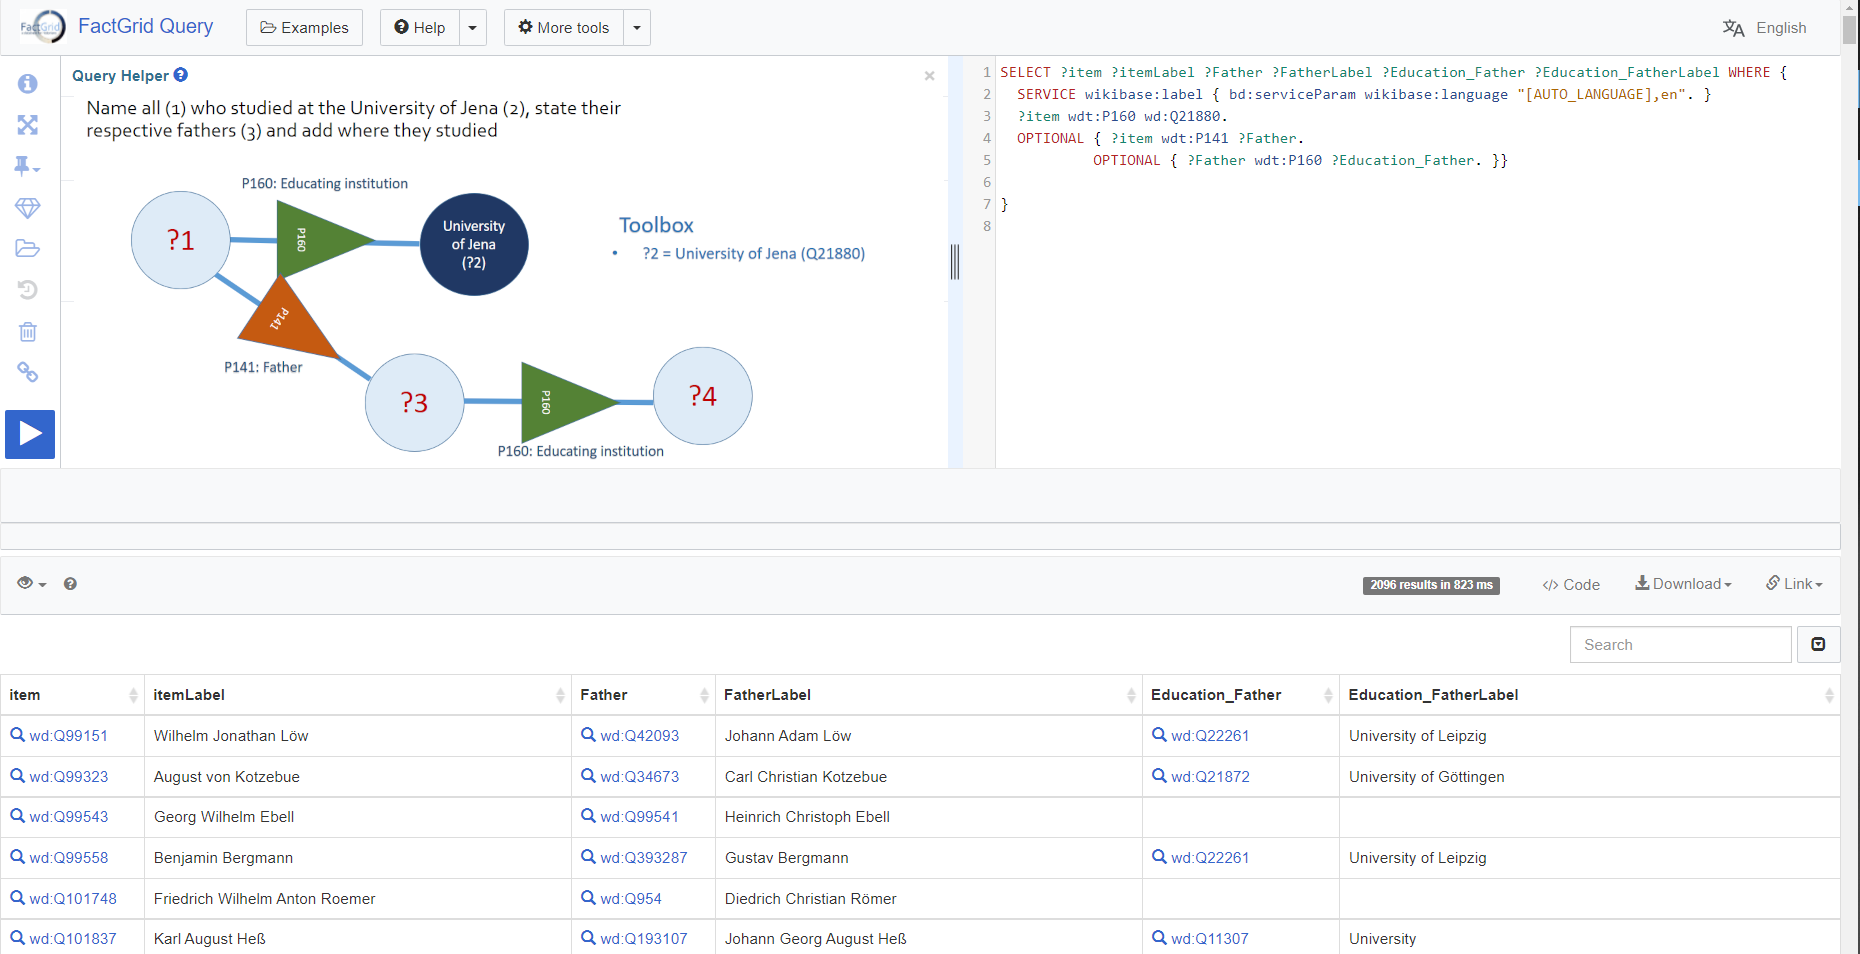
Those who studied at the University of Jena have P160 “educating institution” statements leading from their Items to the University of Jena Item Q21880. This is the SPARQL script (see this link to see what it does):

SELECT ?Item ?ItemLabel WHERE {
   SERVICE wikibase:label { bd:serviceParam wikibase:language “[AUTO_LANGUAGE],en”. }
   ?Item wdt:P160 wd:Q21880.}


SPARQL is a wonderfully versatile language to send searches through graph databases but it is impossible to script even this most simple query without handbook knowledge. What is worse: You will need additional knowledge of our database to know that Jena’s University has this the Q-number Q21880 and that students must have P160 statements on them that will link to this University with the Q21880 indetifier.

The Wikimedia Query Helper is the coolest gadget as soon as you understand what a “Filter” can do for you in your query. Once you realise that this is the input field that will need the university in your specific query you can start to type “Univ…” and the autocomplete will lead you to the Q-number you are looking for. Select the Item you are interested in and the tool will already propose the “who studied here?” Property P160 as this is the most used Property leading to Q21880. It is fair to assume you are looking for people who studied at this university.

You can now ask for more information about these students as far as they are found on their Items, such as the dates of birth and death with both places in separate columns, and the names of their fathers and mothers. This is a search that uses the Query Helper:


And this is where the present Query Helper will leave you. The coordinate locations of the places of birth are on their respective Items (not on the student Items which you have been exploring so far). You need these coordinates to get a map representation, but the Query Helper does not show you how to extend your search into the related objects, nor does it show you how to bring qualifiers into your list (like the matriculation begin and end dates stated with many of the P160 links). It is also difficult to switch to reverse questions. You already know the person and now you want to know more about him, while you are still asked to use a filter…

One should have a graphic – a visual – query editor on a graph database

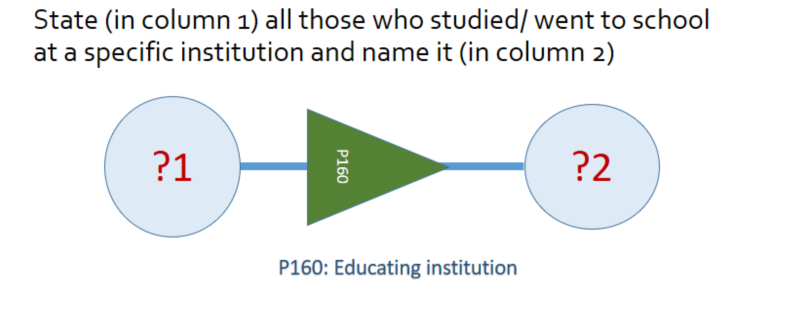
This is what the open question looks like: Who studied where? I put numbers in the circles to designate table columns.

If you are only interested in Jena University students, you should be able to specify that right on the university’s Item. Click into its sphere and type “University of Jena” into the circle:

You can now expand the query as you wish with clicks into the objects or the arrows, for example by asking for the “fathers” (P141) of these sutudents, who will appear in column 3 (this script):

And it will now be easy to get more information from the fathers – like which schools and universities did the fathers attend, again P160 (script link)?

One could also formulate the short-circuit question to get all the students who studied in Jena just as their fathers had done before:

I gave the arrows in different colours because they are the components that make all the difference in objects. You want to spot identical questions and similar objects in your searches.

Optional / Mandatory

Perhaps a simple exclamation mark on the Property arrows would be enough to mark statements that shall work as filters.

Qualifiers

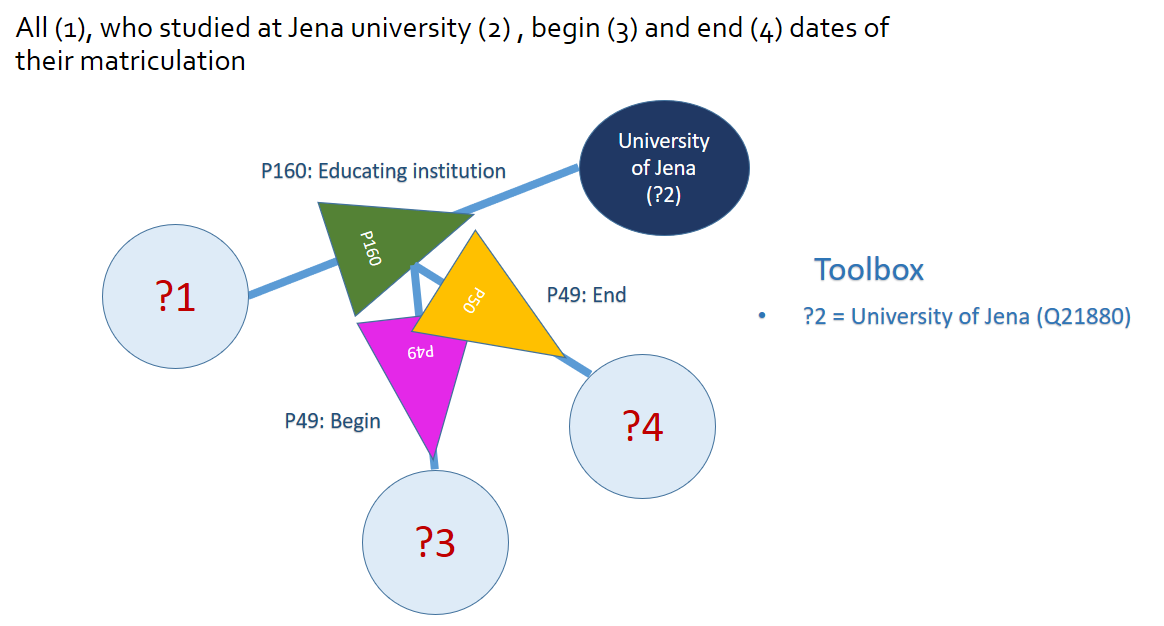
Qualifying statements are a bright Wikibase invention. Any primary triple can become the object of specific, qualifying statements. That is basically the relative clause we need in such a language (for instance if we have a person who studied at four universities and we want to say from when to when on each case). If we want to keep the graphic repertoire lean, we could simply link the qualifying statements to the Properties – for example, to get two separate columns for the begin and end dates of a specific university matriculation:

Opening the toolbox

The toolbox had been open in these various searches. I used it so far to state where a specific Item had a specific value attached to it. We would use this toolbox for all the more complex visualisations. Imagine you want to get the religious backgrounds of all known Illuminati in a bubble chart. Ask for the Items that have a P91 membership statement connected to the Illuminati, Q10677. Then ask for their religious backgrounds. If you want a bubble chart you need a count of hits on each religion and denomination:

The toolbox should also be the place to create time frames. You could here specify ranges on data you have requested.

Just a thought…

A Postscript on how to use the right and left mouse buttons in the query builder

Visual scripting might be actually quite easy. With the left mouse button you create your first circle. It will come with a question mark in it.

Click into this circle with the left mouse button, and you can put a value into this circle, a label; it will replace the question mark.

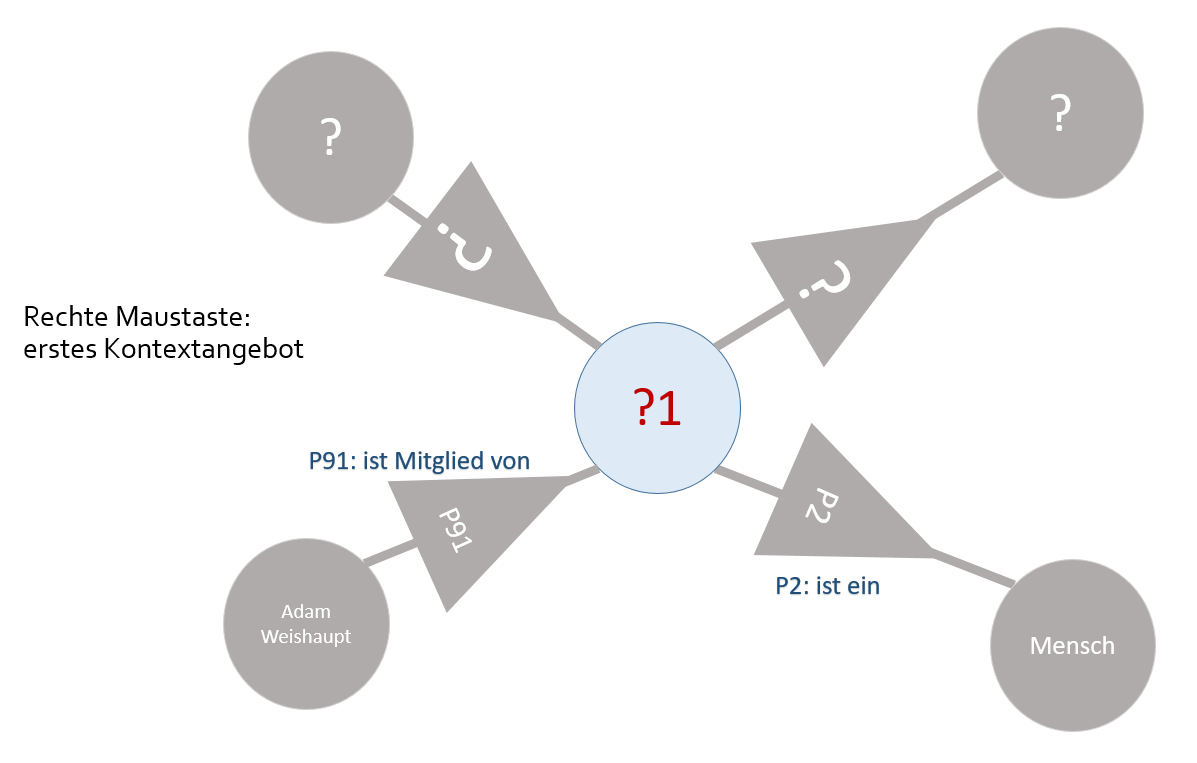
Use your right hand mouse button to get a visual context menu from his point. It will come in the form of grey options to select. Two arrows are leading away from your Item, two are leading towards it. Each time you get an open offer with question marks to replace (or to leave there) and two specific arrows that will give you ideas of what is happening here:

With the left mouse button you can select the direction into which you want to move, the selected arrow and circle will switch to colour, the other three arrows will disappear. You are now free to continue with a click into the next Item or Property of your interest. Just as in the current Query Helper, you will always get a preview of 20 table rows, that will give you an idea of the results you are about to get on your search.


Seen only later…

In einer Graphdatenbank müsste man eigentlich auch graphisch suchen können

[Link for English translation]

Das FactGrid ist eine Graphdatenbank. Das heißt, dass man sich die Datenlage in einer solchen Ressource besser nicht in Form von fünf oder zehn großen, aufeinander verweisenden Tabellen (zu Personen, Orten, Organisationen und Dokumenten etwa) vorstellt.
Das Wissen besteht in einer solchen Datenbank aus Wissensgegenständen – in Wikibase-Instanzen heißen sie „Items“ – und den Beziehungen zwischen ihnen, den „Properties“, sprich Eigenschaften, die diese Gegenstände an andere (oder auch an historische Daten, Links, Bild-Dateien oder Geokoordinaten binden).

Eine solche räumlich vernetzte Beziehung zwischen zwei Gegenständen kann man mit jedem Molekülbaukasten basteln. Hier ein Objekt mit Beziehungen zu zwei anderen. Das kann eine Person (die rote Kugel) sein mit Verbindung zu ihren Eltern (den beiden blauen Kugeln). Strukturell sieht das Gefüge aber nicht anders aus, wenn zu einer Person deren zwei Kindern erfasst sind, oder zwei Universitäten, an denen sie studierte.

Das Molekülmodell trägt nicht besonders gut. In einer Datenbank wie dem FactGrid sind alle Objekte vollkommen gleichartig. Sie alle sind monotone „Items“, die unter Q-Nummern hochgezählt werden. Erst die Aussagen zu ihnen bringen Unterschiede ins Spiel. Ein Vater ist jemand im FactGrid, wenn auf ihn von wo anders eine P141 „Vater“-Property verweist, auf „Mütter“ verweisen dagegen P142-Verbindungen.
In einer Tripel basierten Datenbank (die alles Wissen in dreigliedrige Aussagen zergliedert) genügen zwei Sorten von Bausteinen, etwa Kugeln für die Wissensgegenstände und, weil hier eben Bezugsrichtungen wichtig werden, Pfeile für die Verbindungen zwischen ihnen.

Alle Personen, die an der Universität Jena studierten, findet man, wenn man danach fragt, von welchen Items aus eine Aussage zur „ausbildenden Institution“ (P160) – auf das Item der „Universität Jena“ (Q21880) verweist. So (ausführbares Link) sieht die SPARQL-Suchanfrage aus, und die kann nun niemand so einfach „skripten“:

SELECT ?item ?itemLabel WHERE {
   SERVICE wikibase:label { bd:serviceParam wikibase:language “[AUTO_LANGUAGE],en”. }
   ?item wdt:P160 wd:Q21880.}

Wieso dies alles genau so zu schreiben ist, kann man ohne Handbuch nicht wissen, und man kann ohne Kenntnis der Datenbank auch nicht wissen, welche Q-Nummer man für die Jenaer Universität und welche P-Nummer man für die Aussage „hat hier studiert“ braucht.

Der Wikimedia Abfragehelfer (ist da bereits ein massiver Gewinn. Wenn einem klar ist, was man erreichen kann, wenn man zuerst „filtert“ und dann bestimmt, was einen an einzelnen Aussagen zu den herausgefilterten Objekten interessiert, kommt man mit dem Abfragehelfer erheblich viel weiter. In das Filterfeld kann man etwa „Uni Jena“ eingeben, ohne die Q-Nummer zu kennen. Der Autocomplete lenkt einen beim Eintippen komfortabel. Der Abfragehelfer ahnt bereits, dass einem interessiert, wer hier studierte – das ist die Property, die am häufigsten auf die Uni Jena verweist, sie kommt als erster Property-Vorschlag.

Wenn man nun mehr zu den herausgefilterten Studenten wissen will, kann man von deren jeweiligen Items Aussagen beziehen – etwa die Geburtsdaten, die Geburtsorte, die Sterbedaten und Sterbeorte, Väter und Mütter:

Es ist dies aber auch schon der Punkt, an der Abfragehelfer die Waffen streckt. Wenn man wissen will, wo die Orte liegen (um sie auf eine Landkarte zu spiegeln), muss man durch die Orte hindurch fragen, denn auf deren Items liegen die Geokoordinaten und hier hilft einem der Abfragehelfer nicht mehr weiter.

Es ist ebenso wenig möglich, im Abfragehelfer einen Qualifier hinzuzusetzen, um etwa den Studienbeginn mit abzufragen. Auch die einfache Umkehr der Fragen ist nicht vorgesehen: Ich kenne eine bestimmte Person und will wissen, wo sie von wann bis wann studierte.

Eigentlich sollte zur Graphdatenbank ein Visual Editor gehören…

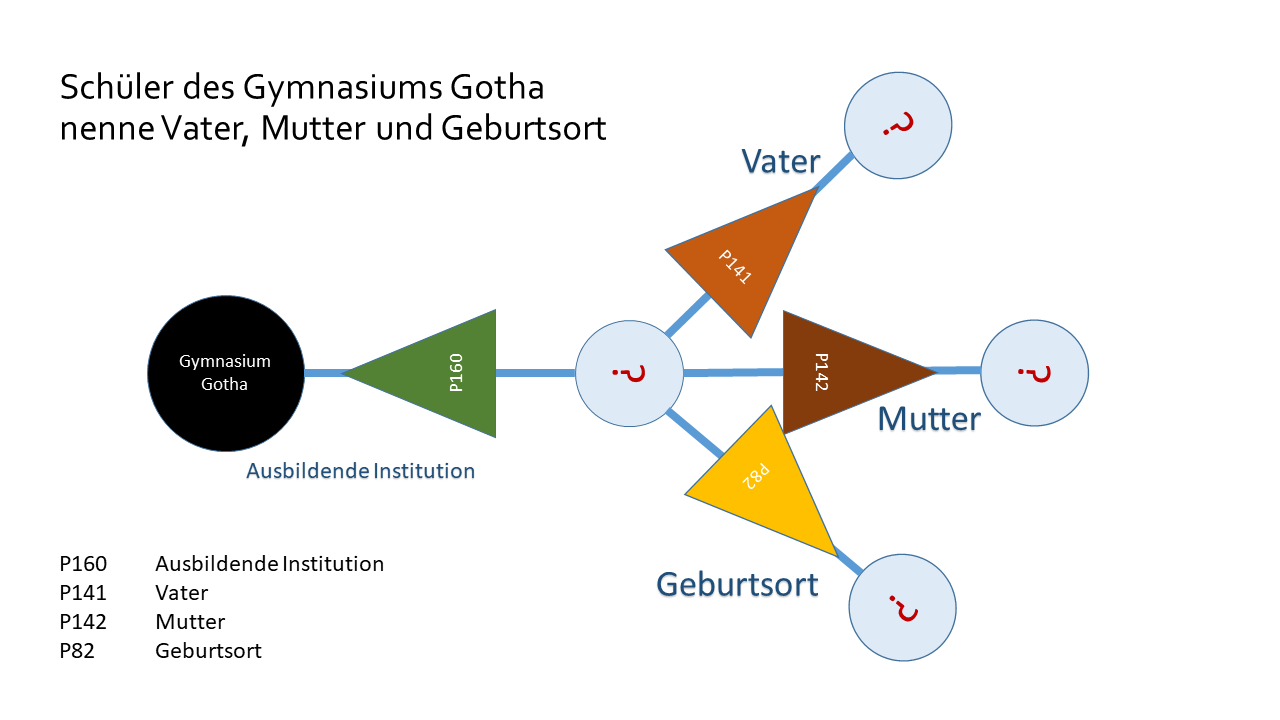
Man müsste Graphdatenbank mit Skizzen der Beziehungen zwischen den Objekten befragen können. Hier die banalste Frage nach Allen, die überhaupt irgendeine Ausbildungseinrichtung besuchten. Wer waren sie, und welche Einrichtungen waren das?

Wenn uns nur Studenten der Uni Jena interessieren, sollten wir das für die zweite Kugel notieren können. Man tippt in den Kreis oder stellt es mit dem Werkzeugkasten klar: der zweite Gegenstand in diesem Spiel soll die Uni Jena sein:

Man kann jede solche Anfrage nun beliebig erweitern etwa, indem man von den Studenten aus die Frage nach deren Vätern (P141) stellt, sie sollen hier in Tabellenspalte 3 gelistet werden:

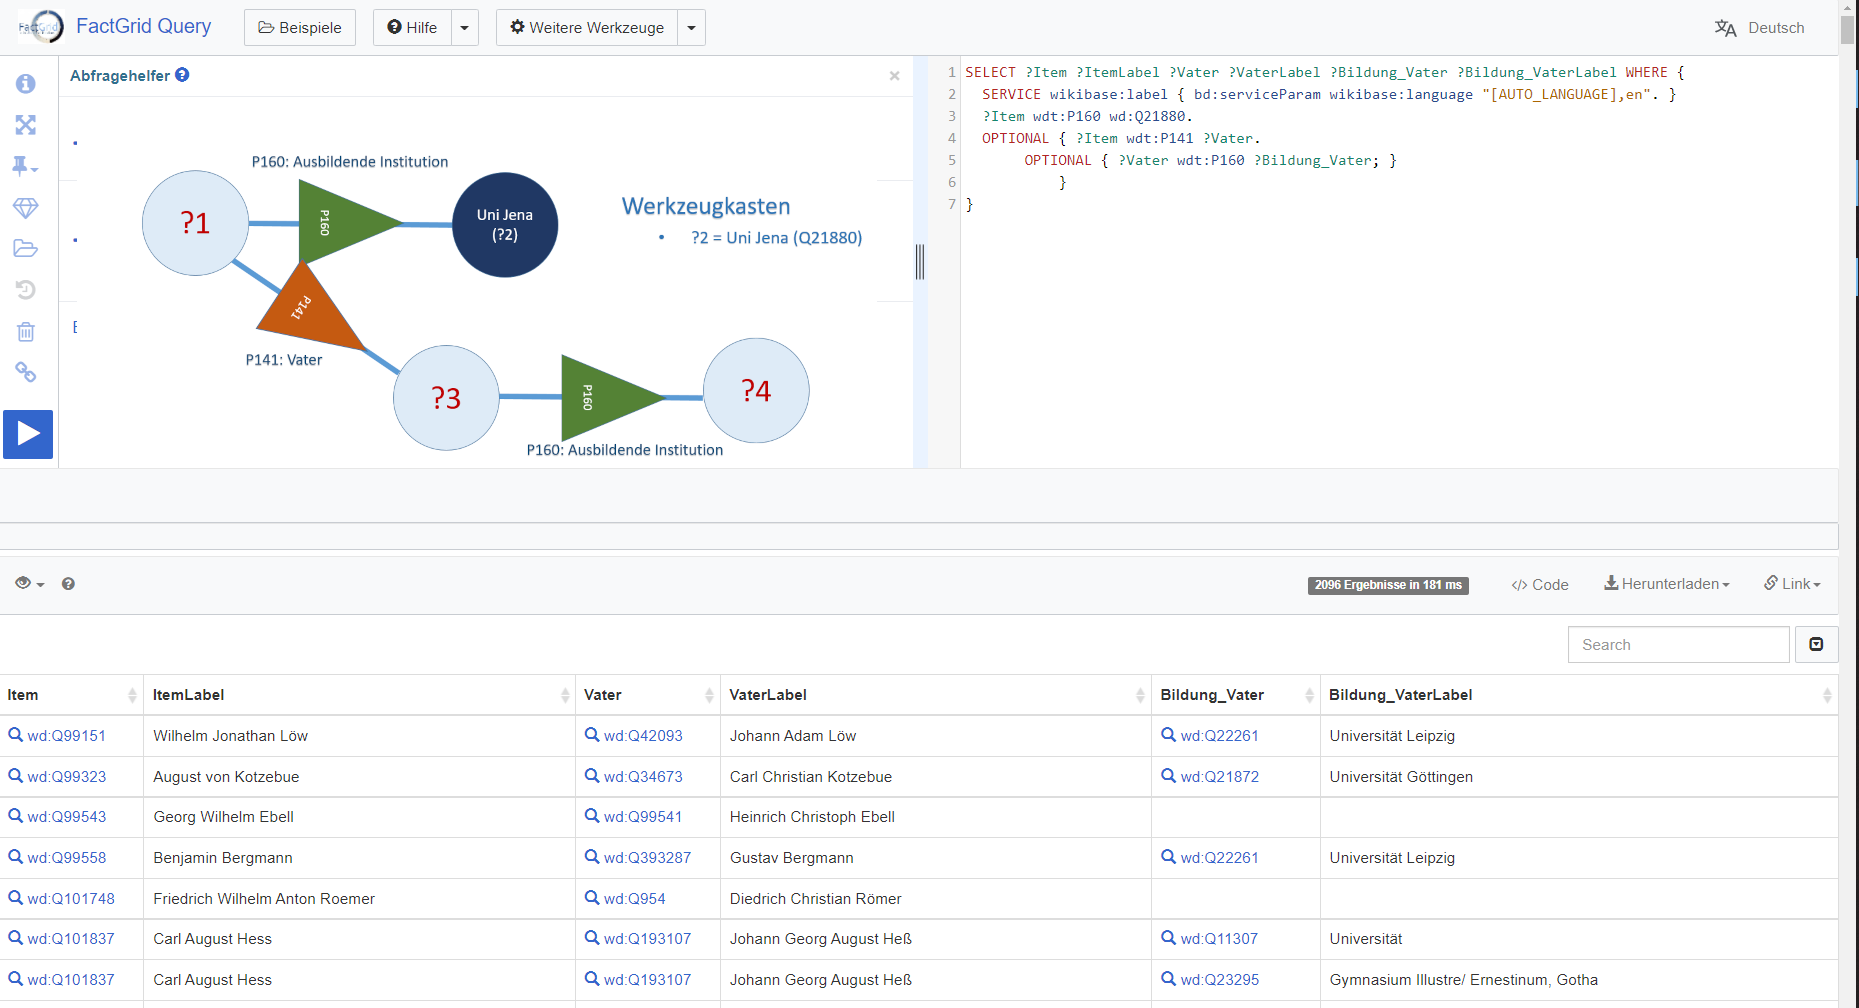
Und man könnte nun sehr einfach den Schritt tun, der mit dem aktuellen Abfragehelfer so leicht nicht mehr zu machen ist: die nächste Frage an die Väter ansetzen. Von welchen (wieder P160) Institutionen wurden diese Väter eigentlich ausgebildet?

Man könnte die Frage auch kurzschließen, um zu erfassen, welche Studenten genau wie ihre Väter in Jena studierten:

Ich gab den Dreiecken verschiedene Farben, um sichtbar zu machen, wenn im Gefüge dieselben Fragen an verschiedenen Stellen gestellt werden (und damit strukturell ähnliche Gegenstände anspielen).

Optional / Verpflichtend

Vielleicht würde man in den Property-Dreiecken mit einem Ausrufezeichen notieren, wenn eine Aussage nicht optional, sondern verpflichtend für alle Funde gelten soll.

Qualifier

Qualifier müssten in der Visualisierung gar nicht viel komplexer sein. Hier wird jeweils ein einzelnes Statement zum Gegenstand neuer Statements. Wenn wir das graphische Repertoire schlank halten wollen, könnten wir die hinzukommenden Aussagen einfach an die vermittelnde Property binden – etwa, um bei den Studenten in zwei eigenen Spalten zu notieren, was die Qualifier P49 und P50 zu deren jeweiligem Studienbeginn und -Ende an dieser Uni notieren:

Filter und gezielte Darstellungen

Ich ließ in den letzten Suchen bereits den aufgeklappten Werkzeugkasten mitlaufen. Der nun sehr viel schlanker Befunde weiterverarbeiten. Eine Suche könnte etwa bei den Mitgliedern (P91) des Illuminatenordens (Q10677) erfassen, welchen religiösen Hintergründen (P172) sie entstammten. Bei einer Statistik, etwa einer Bubble Chart, würden wir die Zahl der einzelnen Treffer wissen wollen:

Denkbar nicht minder, dass man bei Zeitangaben Zeitfenster notieren kann, Werte die größer oder kleiner als angegeben sein müssen, um Befunde ins zeitspezifische Bild zu bringen. Spätestens bei solchen Suchen wird allen, die da schon einmal mit SPARQL hantierten und Aussagen verschachtelten klarer, dass der visuelle Query Editor sehr viel intuitiver und auch sehr viel viel schlanker erfassen würde, was einen bei einer Suche interessiert. Man würde damit spielen können, sich an Befunde herantasten können. Man würde es lernen, in den Datenstrukturen zu denken.

Mal so zum Nachdenken…

PS. Rechte und linke Maustaste – wie man im Visual Editor arbeitet

Wie würde man im Visual Editor seine Suchanfragen schreiben? Vielleicht ganz einfach: Mit der linken Maustaste setzt man einen Kreis mit Fragezeichen darinnen.

Klicke ich mit der linken Maustaste in diesen Kreis, kann ich dort etwas hineinschreiben und das Fragezeichen durch Text ersetzen.

Klicke ich mit der rechten Maustaste in den Kreis, scheinen grau vier Erweiterungsoptionen auf: Zwei Pfeile gehen von meinem Kreis weg, zwei Pfeile führen zu ihm hin. Jedes Mal gibt es zwei offene Angebote mit lediglich einem Fragezeichen darin, und zwei Angebote (zur Erklärung, was hier geschieht), bei denen Muster-Text gegeben ist:

Mit der linken Maustaste kann ich die Richtung meiner Wahl anklicken, diese erscheint jetzt farbig, die anderen drei bislang grauen Pfeile werden damit unsichtbar. Ich kann nun fortfahren und Fragezeichen (von Properties oder Items) durch Text ersetzen, oder auf einen Pfeil oder Kreis klicken und mir mögliche Erweiterungen von hier aus anzeigen lassen.

Wie im aktuellen Abfragehelfer erhalte ich immer eine Vorschau von 20 Zeilen Tabelle, mit der ich sehe, was ich hier soeben getan habe.

9 x FactGrid, Coffee Talk Serie an der Universität Erfurt, 14. April – 16. Juni 2022, Donnerstags 13:30

Die Universität Erfurt lud uns ein, im kommenden Sommersemester eine online Coffee-Talk Serie zum FactGrid als kollaborativer Forschungsplattform zu veranstalten. Neun Themenschwerpunkte haben wir ausgesucht. Die Veranstaltungen sollen kurz und für die Mittagspause zum Hineinschnuppern gemacht sein. Lassen Sie sich inspirieren. Wir bieten eine 15minütige Erkundung mit jeweils offener Fragerunde.

Das Link zur Veranstaltung erhalten Sie für eine Mail an olaf.simons@pierre-marteau.com


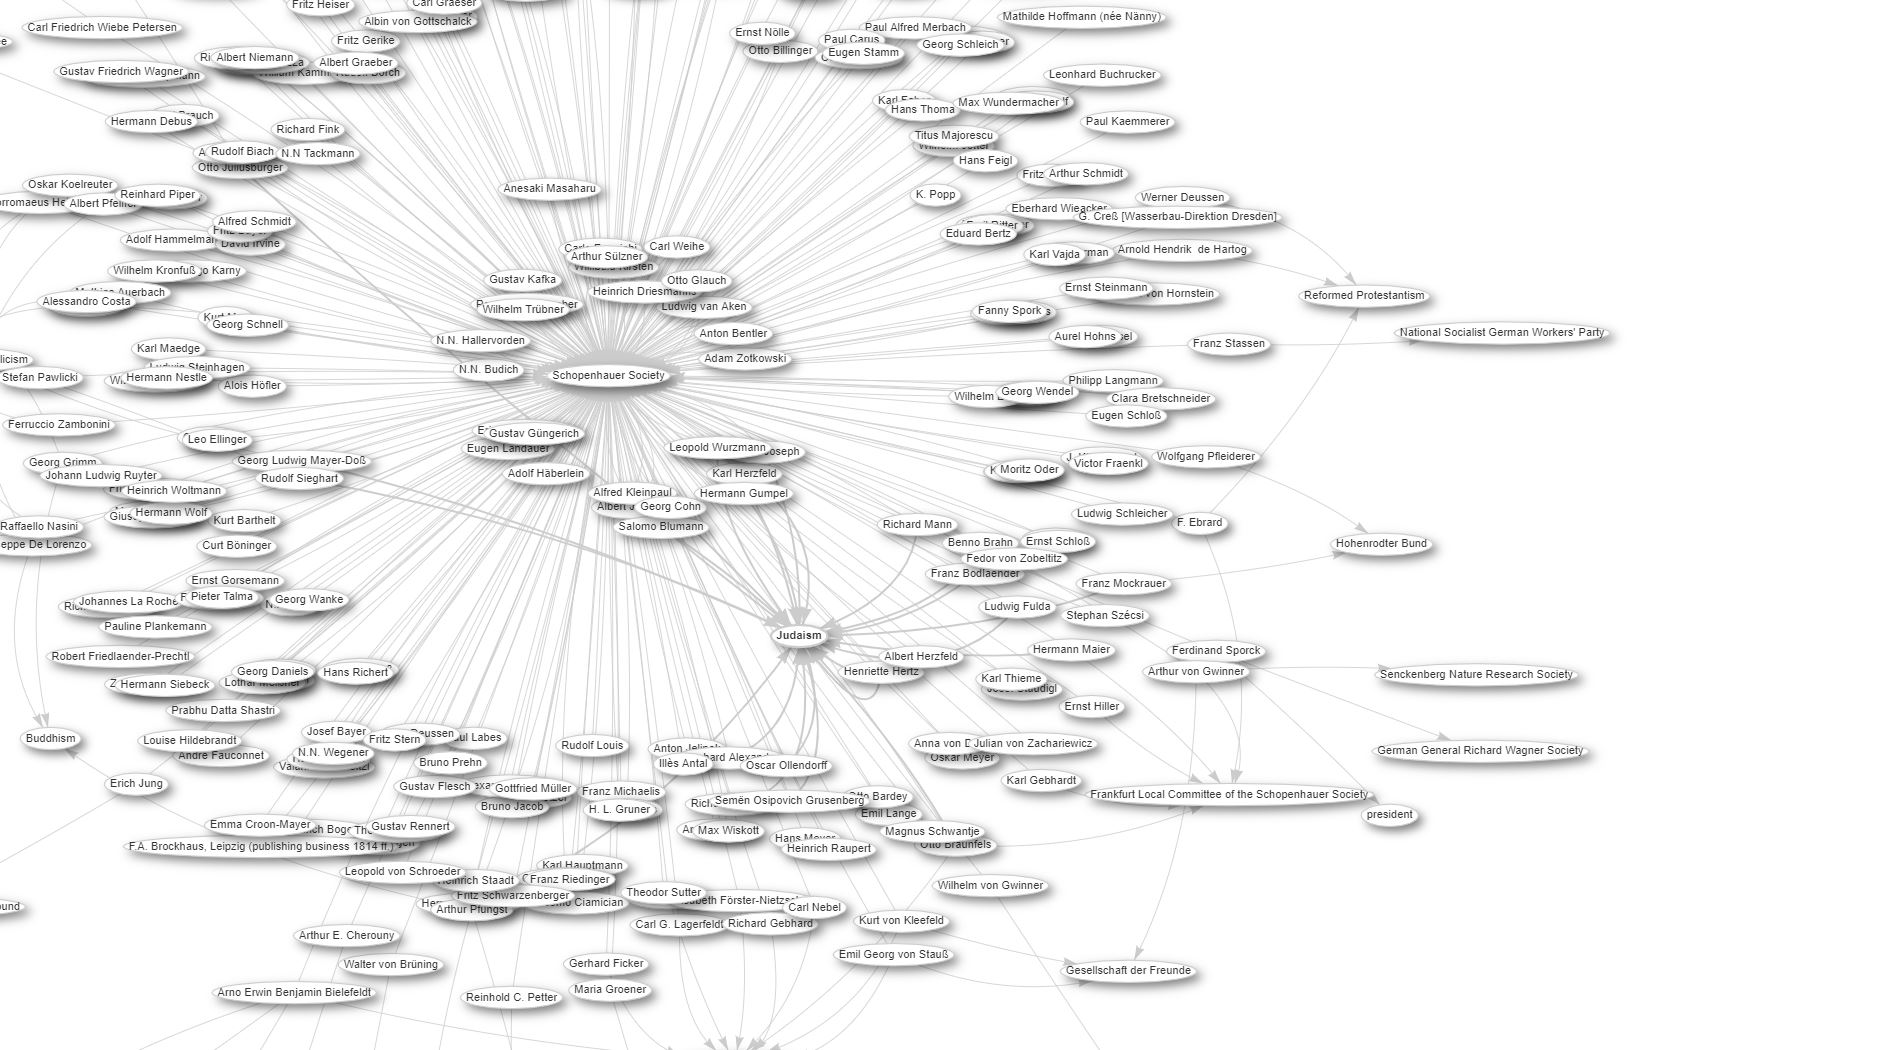
14.4.2022: Sich beim Forschen über die Schulter sehen lassen? — Isabella Schwaderers Erkundungen zu den Mitgliedern der Schopenhauergesellschaft

Netzwerkverbindungen in der Schopenhauergesellschaft, 1912, 1913

Kann man es riskieren, auf einer Plattform, auf der alle Daten unmittelbar offen zugänglich sind, die eigene gerade erst angefangene Forschung laufen zu lassen? Isabella Schwaderer tat diesen Schritt mit ihren Recherchen zu den Mitgliedern der Deutschen Schopenhauergesellschaft und wird hier Einblicke in die Nutzerperspektive geben. Worauf lässt man sich ein? Was ist praktisch? Was ist unpraktisch? Was riskiert man? Was gewinnt man?


21.4.2022: Was immer eine Aussage finden kann, kann ein Datenbank-Item werden — wie Wikibase funktioniert

Wikibase steht im Ruf, ganz beliebige Information aufnehmen zu können. Auf einer einzigen Instanz kann man Information ganz verschiedener Fächer zusammenlaufen lassen und sie nahtlos über alle Fachgrenzen hinweg durchdringen.

Das Geheimnis liegt in der Flexibilität Tripel-basierter Daten. Wir können beliebige Objekte aufmachen und Aussagen zu ihnen beliebig an dokumentierte Datenstrukturen anpassen. Die Eingabe ist einfach. Komplizierter und offener ist, wie man die Daten danach in ihrer ganzen Vernetzung intelligent auswertet.

Ein Blick in die Datenmodellierung, die FactGrid Sample Searches und den Query-Service.


28.4.2022: Daten in 400 Sprachen verfügbar machen

Jahrzehntelang kämpfte man in der Bibliothekslandschaft um globale Datenmodelle und verbindliche Datenbank-Feldbelegungen in der Hoffnung, auf sichere Standards. All das hat das Wikidata-Projekt in seiner mutmaßlichen Notwendigkeit relativiert mit dem Angebot einer einzigen Ressource, die jede in ihr gespeicherte Aussage jederzeit in über 400 Sprachen verfügbar macht.

Wie das geht, ist im wörtlichen Sinne trivial: Alle Aussagen werden zerlegt in Datentripel von jeweils zwei Objekten und einer Beziehung zwischen ihnen, deren Teile man nun einzeln in beliebigen Sprachen mit beliebig vielen Labeln belegen kann. Tatsächlich können auf einer solchen Plattform Nutzer, ohne noch über eine gemeinsame Sprache zu verfügen, die Daten aller anderen in der eigenen Sprache lesen – eine gewaltige Chance für Projekte, die in Teams über Sprachgrenzen hinweg zusammenarbeiten sollen.

Ein Blick auf das Wikidata-Projekt, seine Software und Mehrsprachigkeit im FactGrid.


5.5.2022: Selbstorganisation über Projektgrenzen hinweg

Das FactGrid arbeitet ohne zentrale Redaktion, die Daten erst einmal ansehen und auf ihre Qualität hin überprüfen würde. Auch gibt es keine “Relevanzkriterien” – keine Kriterien, die festlegen, was für Daten in die Datenbank dürfen. Wir arbeiten mit einer verwirrenden Offenheit, die dafür ganz eigene Grenzen hat: Forschungsprojekte (auch private) stehen für ihre Arbeit extrem transparent ein. Wir sind hier an einigen interessanten Stellen anders organisiert als Wikidata.

Wie das in der Praxis geht, welche Konflikte man einkalkulieren und welche Konfliktzonen man eher nicht fürchten sollte – Erkundungen der Plattform-Architektur und der speziellen Freiräume, die wir in ihr Projekten gewähren.


12.5.2022, unusual time 18:00 CET: 350,000 objects with cuneiform inscriptions or: Data as a universal language — session in English with Adam Anderson, Berkeley

This is perhaps the most exciting FactGrid project at the moment – designed to create and to interconnect objects for all 350,000 cuneiform artifacts that known today. Where were these objects found? What events, what people, what places are noted on these objects? As a Wikibase installation we would serve as a database a wide collectively could work on and edit simultaneously in all its various present languages. Data stored on the platform would link into other databases and they would be uniquely easy to download for further work in all other software environments.

Our discussion was about the sheer quantities of data such a platform might eventually handle – if we went into the very texture of these objects, locating not only pieces of information but in further steps all the characters on all these objects in 3D data of the artifacts themselves.


19.5.2022: Georeferenzierte Objekte — Session with Bruno Belhoste in English

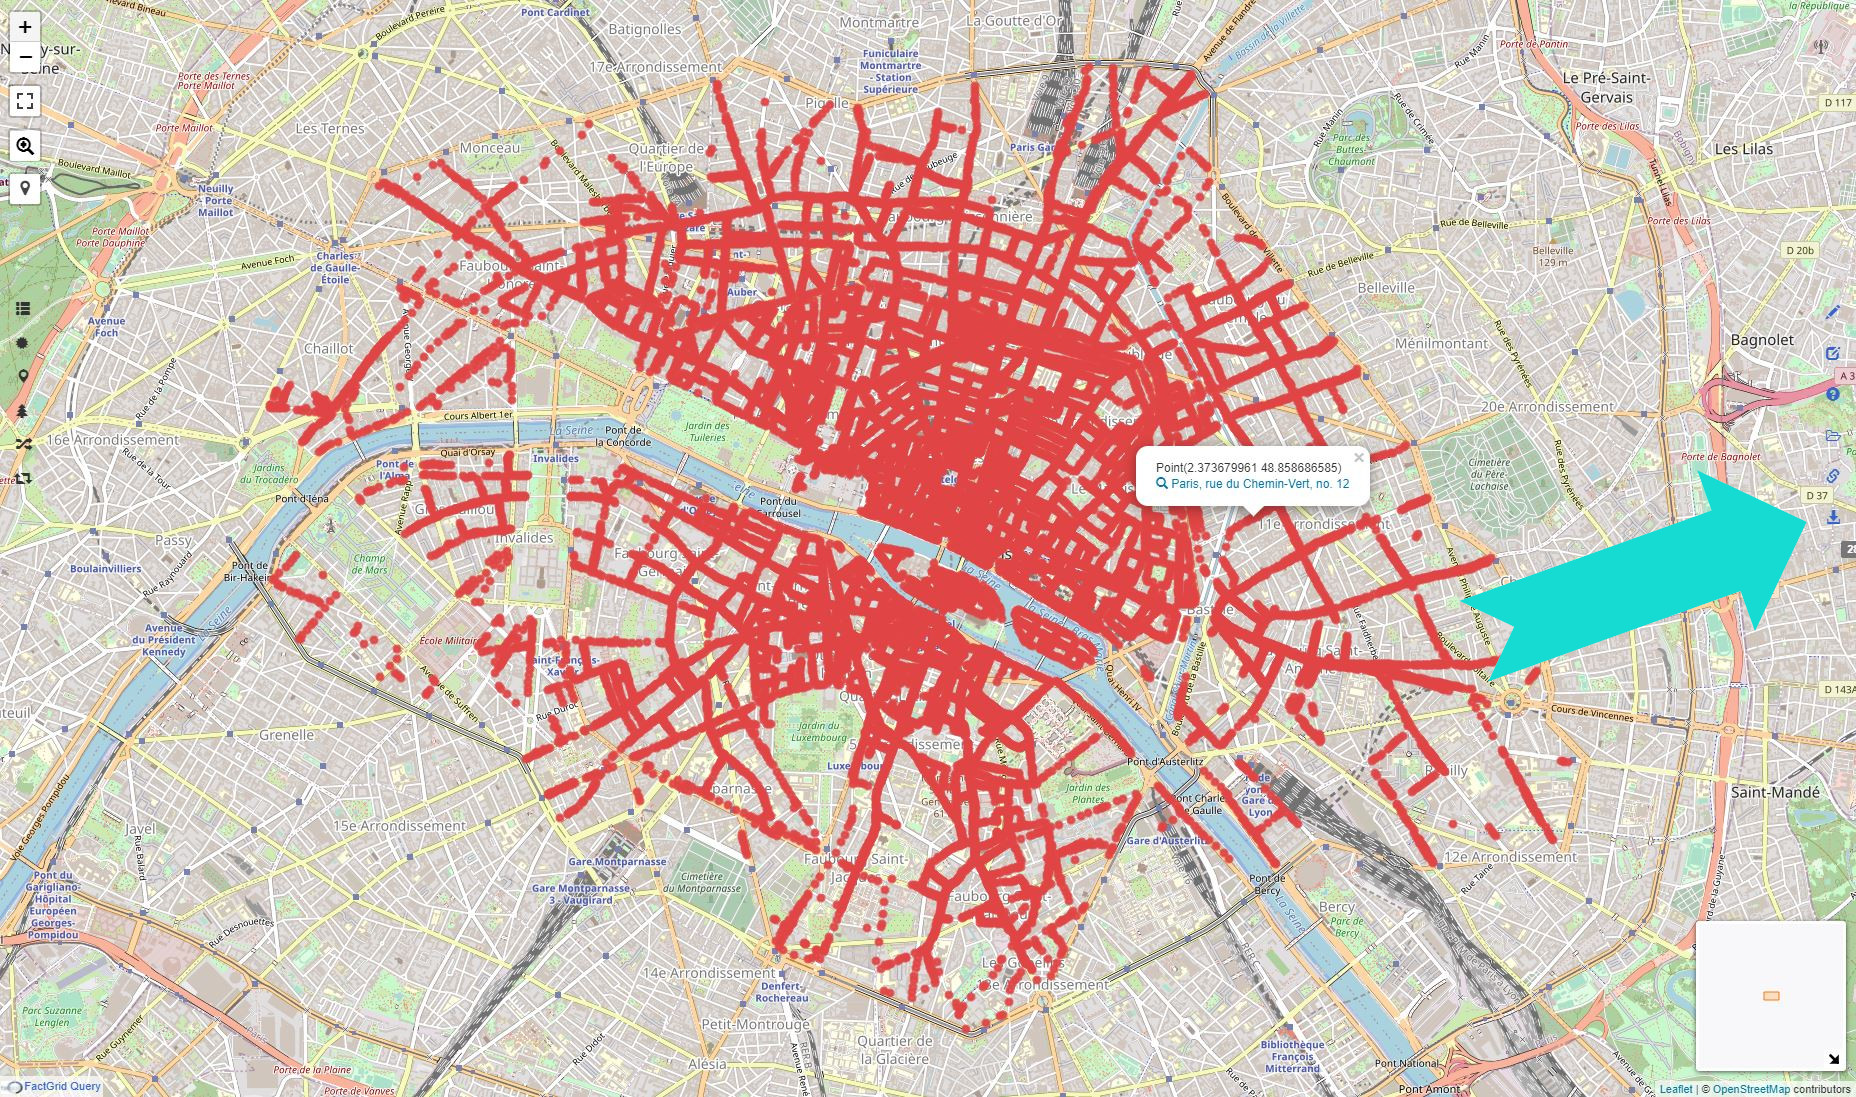
Paris to download (click on the map) / link for the direct table download TSV formatted

Eine Aufgabe, vor der DH-Projekte immer wieder stehen, ist es, Information auf Landkarten zu visualisieren. Räumliche Beziehungsnetze werden sichtbar, Nähe wird greifbar wie der Horizont, den Verfasser mit Korrespondenzen hatten. Soziale Phänomene, etwa die Zusammensetzung der Bevölkerung in verschiedenen Stadtvierteln, lassen sich erfassen. FactGrid-Information ist jederzeit georeferenzierbar. Wir bieten Georeferenzierungen in einem ersten Projekt – Paris to Download – zur beliebigen Nutzung auf der Plattform oder in anderen Software-Umgebungen an. Einige Blicke auf die Projekte und die Software, die hier nach neuen Modulen ruft.


9.6.2022: Genealogie im FactGrid – mehr als nur Väter und Mütter

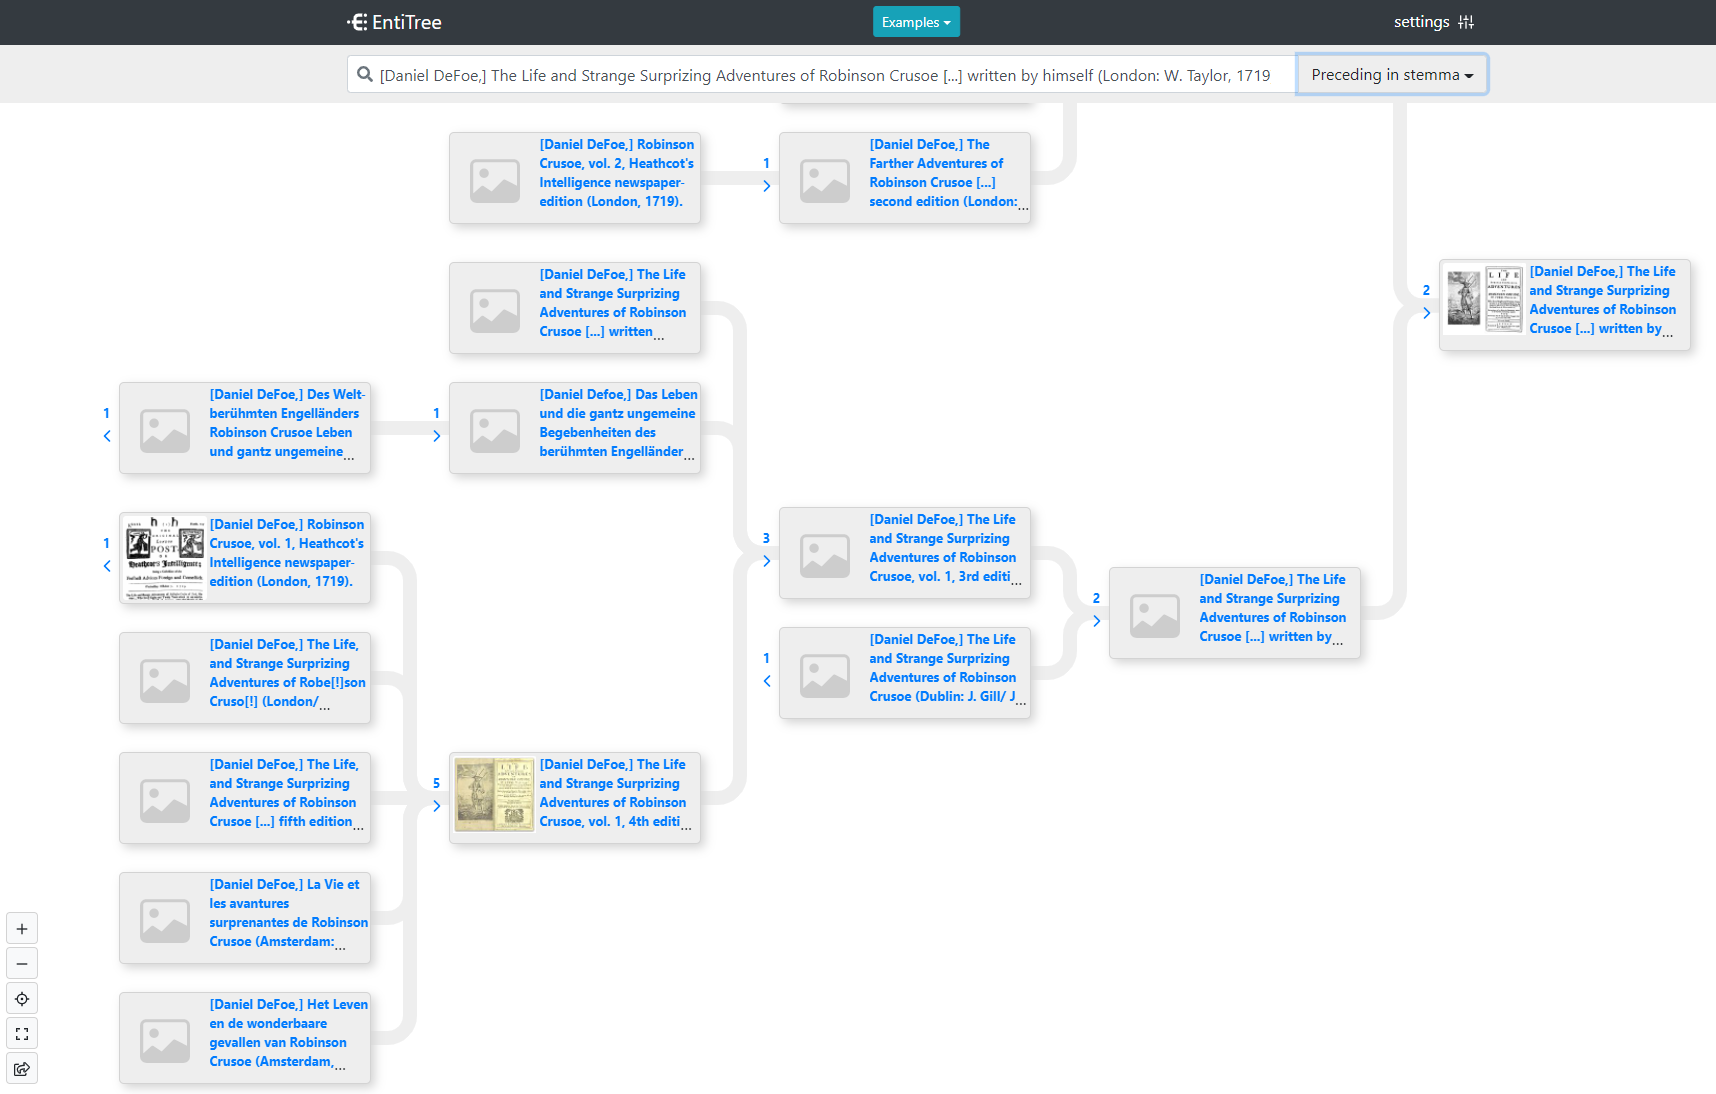
What came after Robinson Crusoe’s first edition? EntiTree Visualisation

FactGrid-Information lässt sich komplex in externe Projekte hineinspielen. Zwei FactGrid Browsing-Tools stehen zu Verfügung. Es lassen sich jedoch auch ganz andere Werkzeuge denken.

Als überraschend vielseitig verwendbar erweist sich die von Orlando Groppo und Martin Schibel entwickelte EntiTree-App, die Genealogien auf bequeme Art und Weise mehrsprachig sichtbar macht. Spannende ist dass sich mit der EntiTree App auch noch ganz andere genealogische Beziehungen darstellen lassen.


16.6.2022: Die Zukunft im NFDI4Memory Gefüge – oder: Dateninseln zu neuem Leben erwecken

Das FactGrid ist seit 2021 gesetzt, um im geplanten NFDI4Memory-Konsortium der deutschen Geschichtswissenschaften als Wikibase-Instanz zur Verfügung zu stehen. Forschungsdatenmanagement ist hier das Thema. Was geschieht mit Forschungsdaten, die am Ende irgendwie übrigbleiben – gesammelt, um den Arbeitsprozess zu begleiten, doch danach irgendwie nutzlos, indes voller Korrekturen und Einblicke, die zukünftiger Forschung nutzen sollten? Was geschieht mit Daten, die bislang auf einer eigenen Plattform laufen, nachdem deren Förderung endet? Wie kann man Daten langfristig sichern?

Das FactGrid will hier die Ressource sein, die Information kollektiv nutzbar macht und langfristig in Zirkulation und Korrektur hält. Praktische Tipps, wie das gehen könnte.

Twenty years on tour: The Velten Theatre Company’s journeys from 1693 to 1712

This may come as a postscript to the previous or as a sneak preview of upcoming projects that will deal with theatre and its history. An interesting topic with all the networks of actors knitting their personal ties in ever changing ensembles of travelling companies that visit cities and courts, of emerging houses with standing ensembles, of authors, of plays and of various roles – and then again of actors who would play certain types in various plays…

The following itinerary follows one of these groups, the so called Hochdeutsche Hofcomödianten or the Velten Company, named after the Veltens, a couple who were the directors between 1670s and 1712.

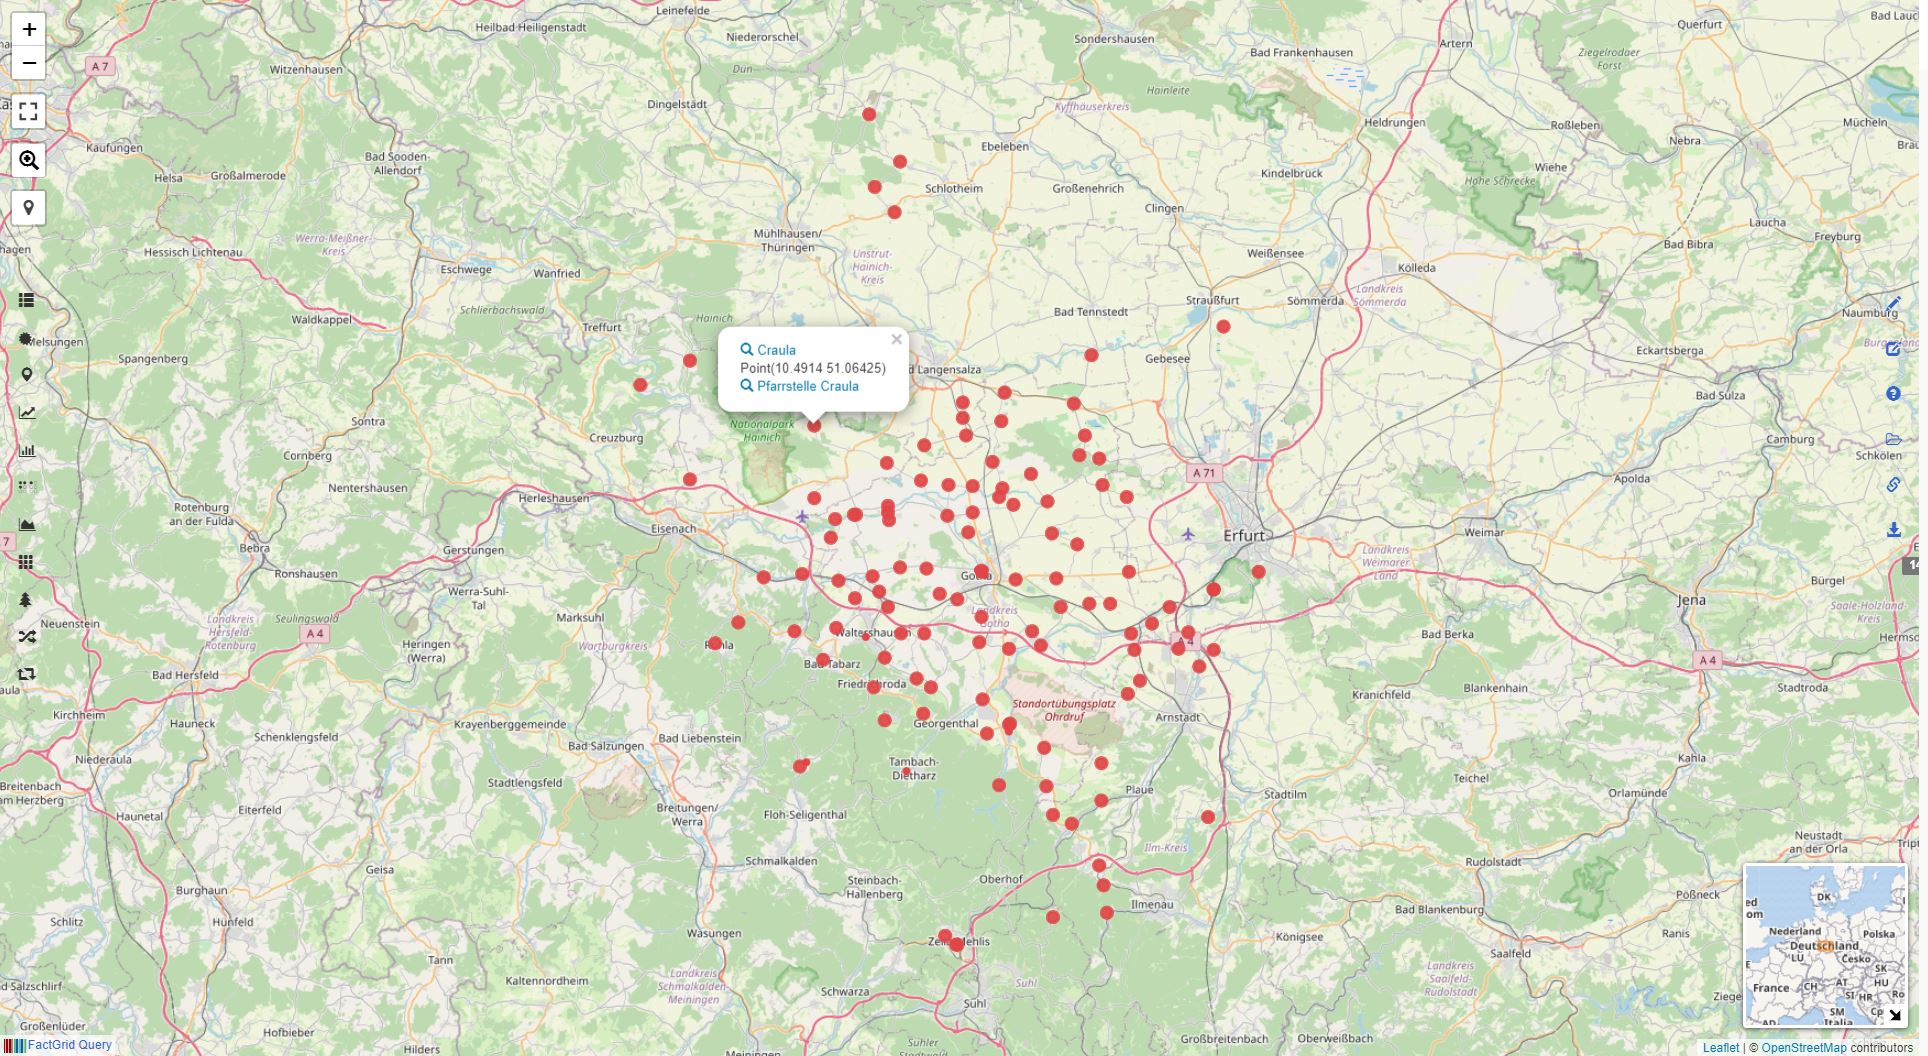
The image catches all the journeys this group took between 1693 and 1712, the years when Catharina Elisabeth Velten was the company’s director. The FactGrid viewer gives the list of the known stays as Günther Hansen noted them in his Formen der Commedia dell’ Arte in Deutschland (1968), p. 269.

The image is interesting as it captures a structural characteristic of the itineraries which theatre companies were likely to produce back in the 17th and 18th centuries. The actors did not travel as tourists. They were rather acting like nomadic families following larger herds as these were looking for ever fresh pastures.

We are speaking here of companies that could have 100 plays in their repertoires. They would come to a place, determine what they could offer as relative novelty – depending here on the rivalling enterprises that had been there in recent years with their respective repertoires. Once a company had been at a place for two weeks it had exploited its repertoire and exhausted the audience. The group could return a couple of years later to attract fresh audiences with plays that would now be interesting. The pattern is therefore more like the pattern groups following herds of reindeer that would in turn find their various regional barriers. Language barriers are the natural barriers of theatre players, though German was here an extremely useful language – spoken in the present German speaking territories but also in much of Poland and in major places in Scandinavia and the Baltic area where merchant communities of the old Hanse world had become major ethnic groups. The Velten Company spoke – as the name indicated – „Hochdeutsch“, High German, not low German the language that would only be understood in the coastal regions.

The visualisation has its ugly sides: No one could use a plane to fly direct way from Stockholm to Vienna. An alternative would be a database that knows contemporary travel routes. An alternative could also be a map with bigger and smaller nebulous spots to see how often they visited certain places – that, however, would not show the difference between them and people who travelled on their “grand tour”, avoiding to visit a place twice.

The list of stays comes with gaps. How do you get from Frankfurt to Leipzig in 1705? Via Gotha and Erfurt? I resist the temptation to get into the locale state archive to find out when they passed through.

We should collect information down to the level of repertoires, actors, and competing troupes, and and get a picture of how this market developed.

Another view

German Wikipedia user Enyavar responded to the visualisation here with this alternative view of times a place had been visited:

Auftrittsorte der Hochdeutschen Hofcomödianten. In dunkelblau unter Paulsen; in orange unter Johannes Velten; in dunkelrot unter Catharina Velten

which adds information on the era of Catharina’s husband, the preceding director, and which gives a clearer view on Leipzig and Dresden, the home base of the company that was privileged by Dresden’s court.


Header image: Balthasar Beschey, La Commedia dell’Arte, 18th century, Wikimedia Commons

How to map itineraries on FactGrid — and Robinson Crusoe’s eight voyages

William Taylor’s typesetter stumbled over the date which Robinson Crusoe’s manuscript was spelling out for his page 46: 1659, “the same Day eight Year that I went from my Father and Mother at Hull“. Either this was a mistake or he had been wrong with the date that was now stated on page 7. There Crusoe was claiming that he had left his parents in 1661. Everyone was in a hurry, so he left two blanks for further clarification, the readers would be able to insert the right date once that was clearer.

First edition of Robinson Crusoe, 1719, omitted dates on p. 46.

The Errata at the end eventually settled the question: It should have been 1651 on page 7. No one had the nerves to replace 16 octavo pages for the correct reading.

The book that was to become a bestseller within less than two weeks was packed with historical detail. If indeed the author was born on the 30th of September 1632, he had to be a man of 86 years by now (DeFoe was in his late 50s, just by the way). Crusoe’s eight voyages came with numerous internal dates and even with geographic coordinates where the author had to spot his island for instance.

The itineraries are a good test ground for visualised searches on FactGrid.

Q219323 is our item for the volume as it was published on the 25h of April 1719. To avoid the interlacing of information I generated an item for the book, an item for Crusoe, the man (Q230282) eight items for his voyages (Q393587 to Q393594) and even an item for Crusoe’s island. All these items have specific context statements on them that allow to single them out as a rather fictional subject matter. Creating the individual items has, at the same moment, the charm to allow the use of all the properties we have created for “real” things.

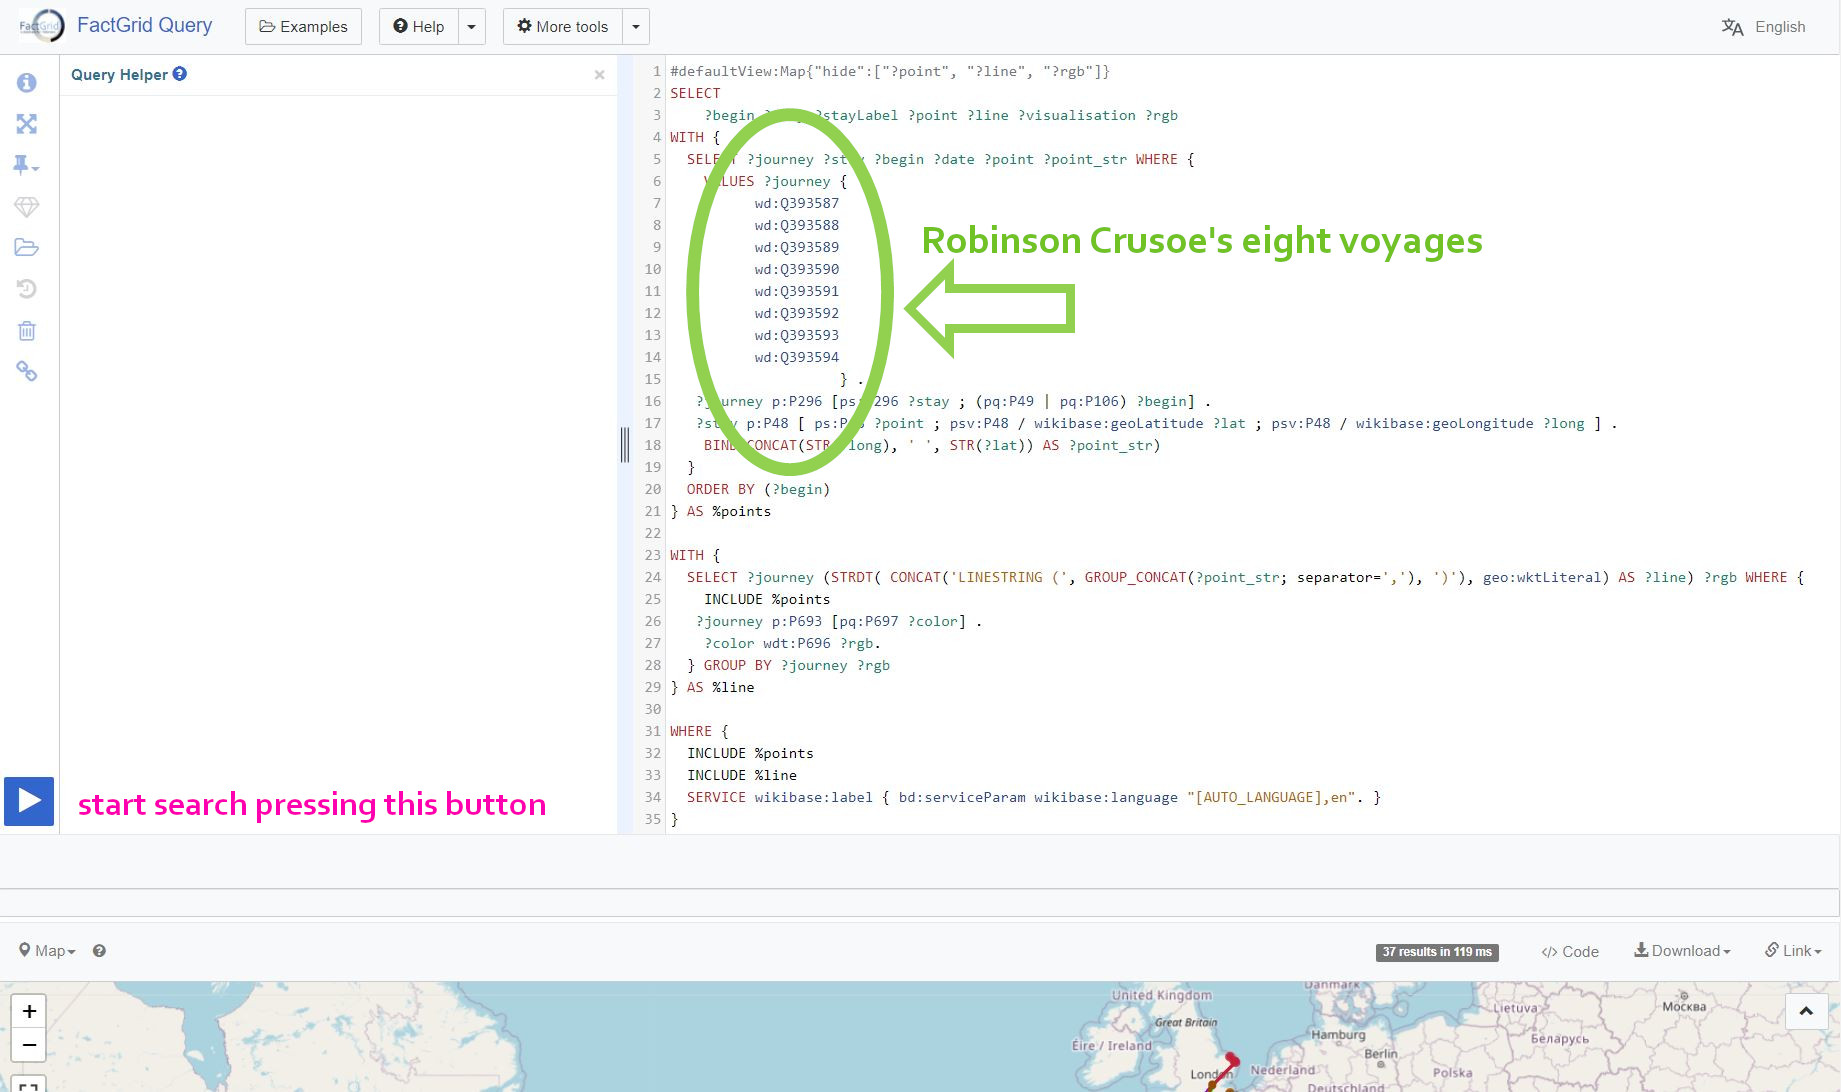
James Heald and Bruno Belhoste provided the script I am employing in the following searches. Ignore the script’s complexity. The nice thing about this script is that you can modify it to run it on your own Q-numbers. This jpg shows you where you will have to list your items:

SPARQL script to bring Robinson Crusoes first eight voyages onto a map

No need to copy the script by hand. This is the search: Crusoe’s first eight voyages, that opens the Query Service with this very script. Press the blue button and you get the map of all eight journeys in one picture. Replace the Q-numbers and you will have your own itineraries on the map.

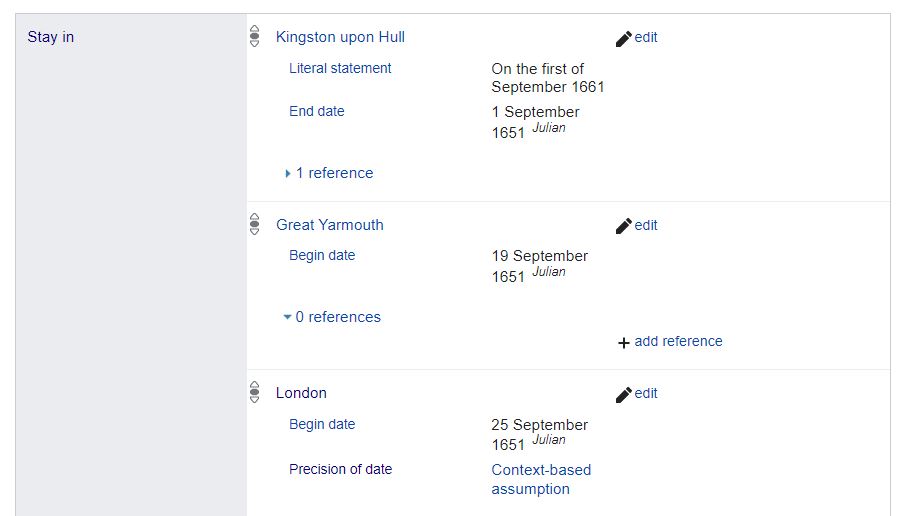
The script is looking into the items listed in lines 7-14. On these items it is looking for P296 statements where the person or group of travellers were staying. The query goes from there into these places to collect the various geographic coordinates. The visualisation will connect these with lines in the sequence of dates that should be given on the various stays, whether as dates of departure (P50), of arrivals (P49) or just as dates (P106) — all three properties are taken into account in line 16. Take a look into the item for the first voyage to see how you have to inform your item(s).

Screenshot FactGrid item with dates

And this is the picture which the query will create:


All eight voyages of Robinson Crusoe’s volume 1 in one picture.

You can change the colours: The information for them is on each item (where you will find a map link with the colour in plain text).

Where do I get the code to embed such an image on web pages?

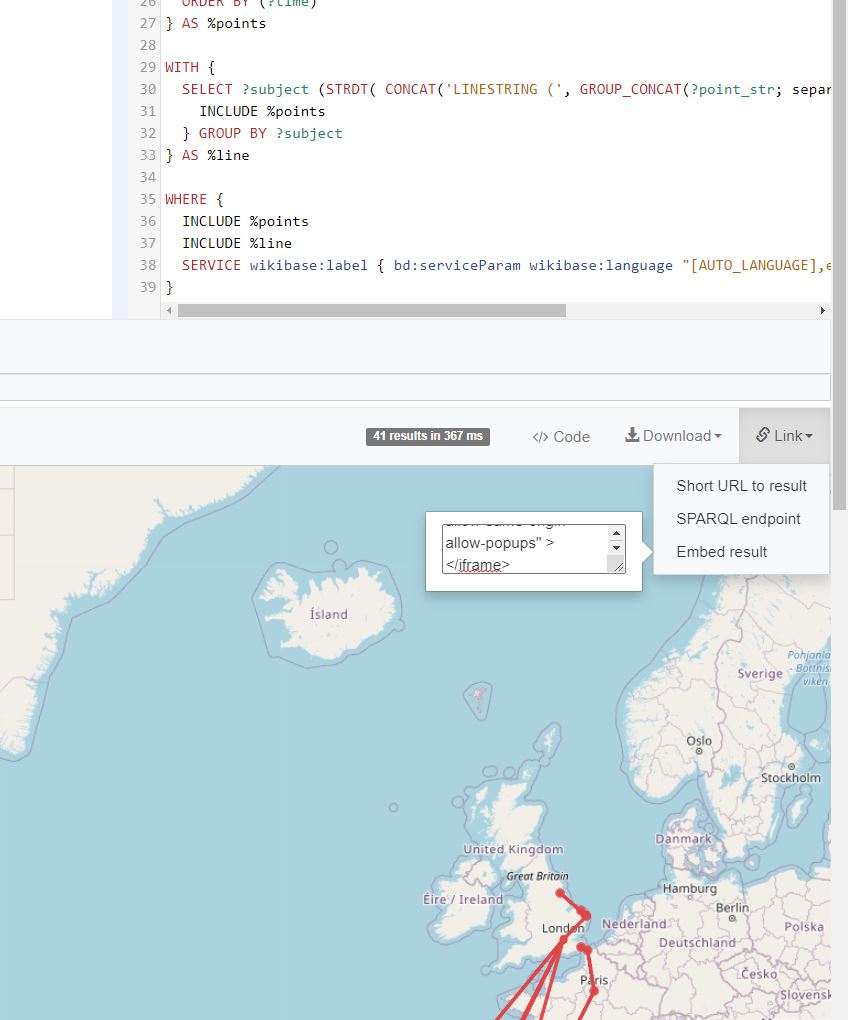
The picture above was not a jpg. You could zoom in and even edit the SPARQL query that generated the visualisation. Whenever you perform a search on FactGrid you cannot only download the data, but you can also get the query as embedded code:

Screenshot, where the embedded code is to be found.

And if your author does not give any dates, just the different places one by one? — like Gil Blas (Q390697) in his history? No problem. You can sort the locations with P499 statements one by one or create any kind of superior sort string as I did in the following Gil Blas search. I am using here the book’s segmentation: 1-1-14 is volume 1, book 1, chapter 14. Replace the P49, P50, P106 date properties for the P499 (number) or P101 (sort string) query to get the respective series of events.

The visualisation is, as I see it right now (on 4 February 2022), incomplete. I am still reading these books slowly whenever I have nothing better to do, and Gil Blas has just left Madrid. I choose this example as it demonstrates the advantage of embedded code.


Tracking Gil Blas of Santillana.

The embedded visualisations always give their pictures as the database provides them the moment the page is opened. The windows are communicating with the database — what is even better: you can communicate with the database right here on this WordPress blog, as the each of the embedded images comes with a menue (on its right hand side, hover over it) that gives you direct access to the SPARQL search engine. Correct or add data on the database (you need an account to do that) and the new information will appear wherever an embedded visualisation will be checking the database — today or over the next years.

More than aesthetics…

One would love to give such visualisations on old maps. click the following link for the visualisation of Crusoe’s eight voyages on https://mappingwriting.com/. My Guinea has moved from the present Republic of Guinea to the early-18th-century location as given on the maps DeFoe could get in London:

“Negroland and Guinea with the European Settlements, Explaining what belongs to England, Holland, Denmark, etc”. By H. Moll Geographer (Printed and sold by T. Bowles next ye Chapter House in St. Pauls Church yard, & I. Bowles at ye Black Horse in Cornhill, 1729, orig. published in 1727)

A line from DeFoe’s London to this Guinea has the smell of modern air traffic. Crusoe’s captains were travelled along the coast lines wherever they could. Yet following their practices is ugly as we do not have these routes in the machine. We are connecting locations, and here I have already interpolated two costal places and two groups of islands to avoid the straight trans-African passage without a conformation from the book.


Crusoes first two journeys.

The nice thing about creating all this on FactGrid is that you can add any amount of further information on these stays and journeys, like the page references, connections to other items or in depth information on places. So lots of things to play with and to do with your own data on FactGrid.


See also

  • “Art collectors and the Holocaust: itineraries from birth to death”, at Open Art Data… Linking Databases To Detect Looted Art, Dec 19, 2021 https://www.openartdata.org/2021/12/art-collectors-and-holocaust.html
  • A Quarter of a Million Items on FactGrid – just a brief reflection

    Germany’s national author Johann Wolfgang von Goethe called it a “masquerade in red and white”, but was himself a member (just as he became a member of the Illuminati a little bit later; it made sense to join such organisations and to know from within what they were all about). Freemasonry was in its most idealistic terms an updated edition of the brotherhood of men united under a simple and strikingly anti aristocratic system: the system of the old craft guilds. With their three degrees of apprentice, fellow and master there was no room for privilege of birth. German masonry evolved from the late 1730’s through the 1750’s principally as a system of four degrees, with Scots Master at the apex and the development did not stop there. The chivalric degrees of the 1760’s and 1770’s gave way to increasingly complex systems, overgrowing this initial construct. These high-degree systems claimed roots in the middle ages if not deeper pasts, synthesising Christianity with alchemy, magic, and theosophy. Masonic entrepreneurs travelled through Europe selling secrets which they would convey in extraordinary lodges. What they offered would have been considered heresies only a generation before, and now became a market of esotericism – a market that turned the masonic world into its first framework and distributor. The Strict Observance or Order of the Temple, the masonic high-grade-system founded by Carl Gotthelf von Hund und Altengrotkau in Germany in 1751 was the biggest player on this stage in central Europe – the system of red and white, the colours of the Knights Templars.

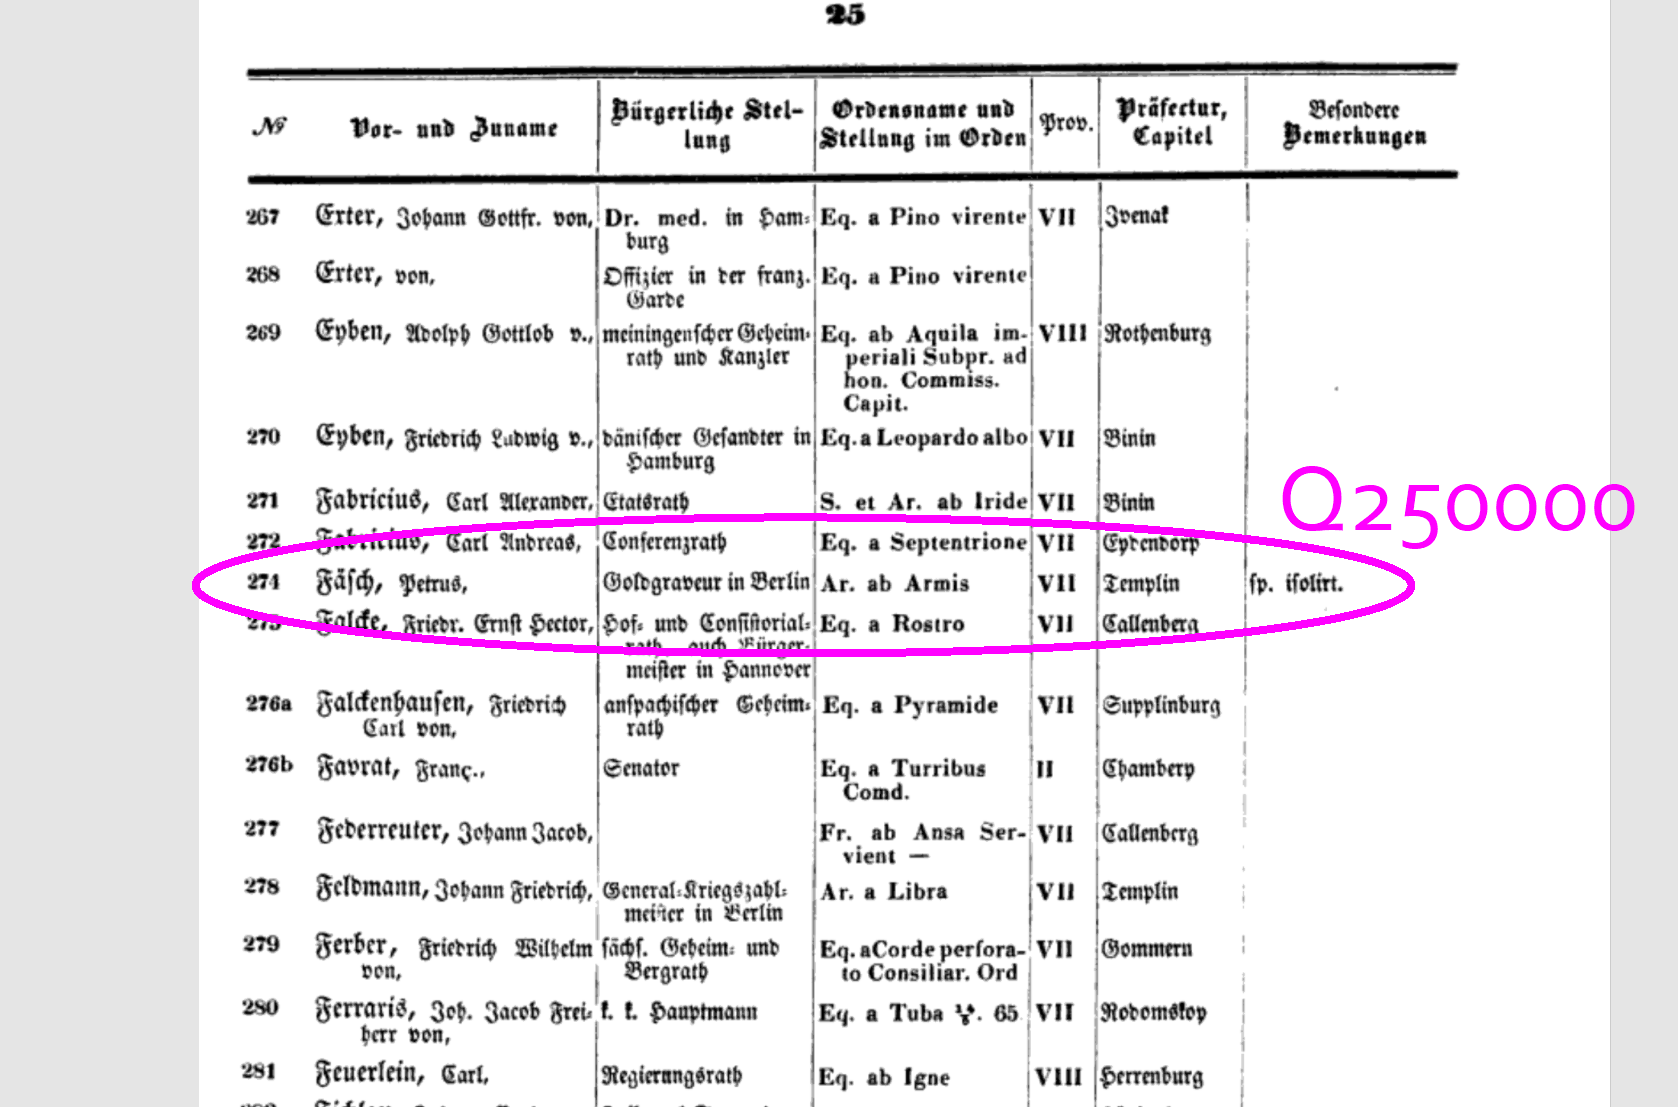
    Q250000 is the FactGrid item number of Pierre Faesch, a Frenchman, by profession a gold engraver, who settled in Berlin where he and some of his friends eventually founded their own lodge “Indissolubilis”. He was number 274 in von Lindt’s list of the members of the Strict Observance, published 1846 – number 274 of the 1,266 members he could establish.

    Josef Wäges broke the quarter of a millionth item with the input of this list on May 10, 2021 at 7:20 (EST). FactGrid became immediately the most interesting environment for this dataset. 180 of his 1,266 records were old acquaintances: members who already had their Q-numbers on FactGrid. But the new data set which anyone can now create on FactGrid is substantially bigger: it lists 1,595 members with interesting overlaps of projects that have been working on FactGrid over the last three years:

    Josef Wäges will publish a more detailed article on the dataset in a lavishly illustrated blog post. The links to the Illuminati are perhaps the most interesting thing to explore in this data set. Von Hund’s claim that the Strict Observance had its roots in the order of the Knights Templar had been both immensely attractive and explosive. The heads of the medieval Order had burned on the stake on May 12, 1310 – but the organisation had gone underground and fused into Scotland’s crypto Catholicism, so the story goes, including the idea that the “Pretender” (to the British throne) was the secret leader of the organisation. The Strict Observance soon expanded from Germany to France, Sweden, Italy, the Baltics and Russia. State leaders became Knights of the Order and met in fancy costumes while members like Goethe or Christoph Bode could easily cast doubts on the historical construct. Von Hund died in 1776 without having given the final proof of the legacy. The organisation itself was by that time in financial troubles over plans to create an insurance system for its members on a foundation of factories, which were to be built under command of the Order on the eve of industrialisation, an organisation that was not really established in the world of modern capitalism.

    The internal conflicts culminated in the summer of 1782 when the rank and file of the Observance met at their last convention in the resort of Wilhelmsbad near Frankfurt am Main. The alleged history stood in the centre of the debates and tore the Order apart while a new organisation was secretly emerging behind the scenes: the Order of Illuminati, both as an antithesis and also as a potential heir of the entire infrastructure. They too were by 1782 a masonic high degree system, and they infiltrated lodges far more cunningly from below than from above. With the help of young “Minervals” which they tunnelled from below into the lodges of their interest, and from above with the help of masonic functionaries in the Illuminati leadership. The fascinating thing about the Illuminati was that all the bombastic narratives were handled as little more than a Machiavellian façade by those who acted as “Unknown Superiors” in the hidden centre of this organisation.

    Our critical mass: strange organisations of the second half of the 18th century

    FactGrid is growing fast. We are doubling our numbers almost every year; that is the more superficial message of the Q250000 jubilee. The more complex message will be: We are (thus far) growing particularly well where we reached our particular critical mass. Entries like Pierre Faesh are the almost ideal subject matter for a Wikibase installation. No portrait has survived, we know little about the biography but we can produce some interesting details with far reaching network information. A genealogy software would not be versatile enough to handle such knowledge. A regular Wiki, with its focus on articles to be written, would on the other hand need to be filled with desolate fragments of repetitive information – we do not know enough to write interesting articles about these people. Using a Wikibase we can easily turn the few points of data we have into an asset. If you want to know more about the “Strict Observance” we can offer the sociological details, networks of the members, family ties, knowledge of the organisation and its surroundings: We can list the various organisational ties of these members and we can – theoretically – give a picture of the landscape of Masonic organisations as they grew and changed from the 17th into the 19th century.

    Not quite the software of citizen science: Our Gotha specialisation

    At an early point we decided to test the software on the wider audience in a local experiment. Gotha is a small town of some 45,000 inhabitants. We could easily give database courses at the Research Centre. The local project developed with mixed success: Gotha’s Archive of the Lutheran City Church embraced the offer of the free database. Heino Richard of Gotha’s genealogical society entered this project and created its biographical backbone with some 20,000 biographical records linked to the archive’s work and to the city’s history. The integrative appeal remained, however, comparatively weak.

    The Wikibase conclusion so far, is interesting in the hands of researchers who are delighted about the flexibility they get with this software. The same tool remains opaque in wider use. We will need interfaces for genealogists and archivists to make broad editing easier, and these interfaces will come.

    Novels, religious dissidents, medieval codices and Nazi concentration camps – leaving our comfort zone

    We are, nonetheless leaving our comfort zone, the zone of late 18th-century biographies, and this is challenging wherever it leads into fields of information without more comfortable background knowledge:

    • Marie Gunreben of the University of Konstanz has started a project on German novels 1670 to 1750. We have widened this project. We should get the European flow of developments into the picture, the exports and imports, the flow of translations and influences across the European borders. The move is an immense theoretical challenge: We are using a software that creates essential notions of sameness wherever it sets a Q-number. The modern English “novel” should, of course, be the modern French or German “Roman”. But the conceptual equivalents do not really lead us back into the early 18th century. The English “novel” was back then what we will today call a “novella”. Robinson Crusoe, if anything, was a “romance” – a spectacular move in 1719 as the romance had just been pronounced dead, finished by the modern novel(la). How should we handle different conceptual developments in different languages? We are experimenting with set language Items and with Q-items that use the modern conceptual frame as an alleged continuum. It remains to be seen how this will work.
    • Lionel Laborie is about to open the long-expected section on Early Modern religious dissent which our present data have been calling for for the last three years. Freemasons, Rosicrucians and Illuminati, quasi-religious associations built upon a new consensus that their members would leave all their confessional controversies aside and focus on a truth beyond. The result was not exactly deism that shined through all the allusions to God as the master builder and supreme architect. It was rather a competition of increasingly eclectic historical constructs of diverse religious dimensions – of heresies in the old terms of the Catholic or Lutheran orthodoxy and these new orthodoxies emerged within this spectrum with different systems that would not necessarily acknowledge each other. If successful we should be able to eventually give a sketch of the changing map – now with a perspective on the biographies that travelled on this map of ever changing options.
    • Isabella Schwaderer already wrote about her project. She mapped the members of the first two years of the German Schopenhauer Society founded in 1912. The project that began as an experiment led to experiments: Isabel Heide and Martin Gollasch introduced a couple of bigger data sets with the prominent prisoners of Theresienstadt, the map of German concentration camps, and the list of German university academics who signed the declaration of allegiance to the new Regime in 1933. These sets have not yet gained a greater depth of information. They were rather created in order to break the ground for new projects that will discover with a look at early 20th-century networks.

    Steps into uncharted territories are a challenge on a Wikibase. You want to augment and to interconnect known objects, you want to work on the basis of our collective present knowledge and suddenly you have to create ever new objects that need ever new objects in order to make sense.

    The Middle Ages – the new territory where we will see the biggest growth on our course to Q500000

    We will enter new fields and Q500000 is already knocking at our doors. Led by Charles Faulhaber the trilingual PhiloBiblon project has decided to fuse their data into FactGrid – 450.000 items of (late) medieval Iberian books and manuscripts. The project will be a test. We might arrive at the conclusion that the global text production deserves its own Wikibase. It might just as well dissolve the present demarcation lines between archives and libraries on the one hand and historical research on the other. Historical information is in its last consequence not much more than an interpretation of remaining textual and documented evidence. We will bring the evidence and the interpretation onto the same platform.

    FactGrid will learn Spanish and Portuguese in the course of this project. The PhiloBiblon group arrives as a team of superbly informed people with different specialisations from data management and librarianship to (literary) history. The technical aim will be to create a user interface on the specific material base that will communicate with the database. FactGrid will act here in the background – nothing to regret, rather the model to go for: The model of a single compound of knowledge that serves various projects as the reservoir of broader collective knowledge.

    In the middle of technical developments

    Wikibase is not yet a widely used software – it has the potential to become this software. The problem is apparent in any imaginable “normal” use case. You search something – but how do you search anything on the SPARQL Query Service? – on a Query Service that expects you to know what you can search and how you would ask for it – without giving you the slightest hint on either question.

    You can use the Wiki surface but here again you will be puzzled. What exactly is the message of these Item pages that collect various statements without order and cohesion? Even if you arrive at a complex item like Q133, Christoph Bode, that item will not tell you half of the story – it does not tell you that this man is the author of hundreds of letters stored in this database, and the recipient of as many – who is mentioned in hundreds of other sources the database has registered.

    Markus Manske’s Reasonator gave a glimpse of what one could do with a Wikibase such as Wikidata: One could produce well-structured pages of information automatically in hundreds of languages. The Reasonator did not make it into the software package nor is it easy to use on an external Wikibase.

    We will get such browsers – not in the singular but in the plural of general and specific purposes and two of these have entered a test phase last month: Bruno Belhoste’s “FactGrid Viewer” and Michael Ringgaard’s “SLING Browser”. Both seem to do pretty much the same job, but they are doing it differently, opening doors into quite different future developments.

    Bruno Belhoste’s FactGrid Viewer (you have been using it over the last minutes wherever you followed the Item-links in this article) is drawing its information straight from the database as you see it. Change data on FactGrid and you will see the new situation with the next browser update. You can switch languages. You get a history of your movements on the site and you get an idea of where you are with a specific item as the object is connected to “what links here?” information.

    You can implement Bruno Belhoste’s viewer – pure Javascript – on any website anywhere in the world to see your choice of FactGrid data – the solution for projects who want to use the FactGrid database simply as their database without a further interest in the broader platform.

    Michael Ringgaard’s SLING Browser works on the basis of the data dump which FactGrid supplies every evening around 21:15 CET. A new edition of the SLING browser’s presentation of information is created every day. The potential is visible in an intricate detail: The Q-Numbers of SLING browser searches are not necessarily FactGrid Q-Numbers (Christoph Bode our Q133 is on the SLING Browser Q213880). If there is information about the same object available on Wikidata the SLING Browser will give it under the Wikidata Q-Number, and this is only the beginning of the upcoming development: We will eventually see pages that accumulate information from various Wikibases – not in a show of serialised harvests but in a single coordinated representation that accumulates information and that marks the differences only where it arrives at disagreeing statements. This is a tremendous step into the world of “federated Wikibases” that will eventually present the best information of specialised platforms that all speak a common language of triple based statements.

    Both browsers are part of the FactGrid-menu-structure but not yet the breakthrough to a simple widespread use of our data. The big issue is at the moment the missing search interface. Google will lead you straight into our items – where you will be lost before you understand how you can navigate on such a platform. The two browsers do not give you a better search interface than the input field on the database’s wiki. If you have just the last name of a person and a rough idea of where they lived that will not help you here or there. You will get to the family name without a hint of how to find those who lived with this Family name. Future Wikibase browsers will have to overcome these dead ends of the individual browsing histories; they will need an advanced search to access data in the first place and internal information that shows why the database has listed the particular object. We will see these interfaces becoming available in a variety of technical options and a broad range of integrations over the next few years.

    Integrating FactGrid: NFDI-4Memory participant and GND partner project

    We have been surfing a wave of success over the last three years – the wave which Wikibase was creating, the software that is about to be used by national libraries worldwide and in “National Research Data Infrastructures” all over the world.

    The reason why National Libraries are experimenting with Wikibase platforms is simple: They have all created authority control data to run the various catalogues that use these data. Humans can understand that Death in Venice was written by Thomas Mann, the 1929 Nobel Prize in Literature laureate. Fresh publications under the same name must have other authors of the same name and this is where databases need a superior form of knowledge. They will handle the 28 authors under that name in a combination of unique identifiers (supplied for instance by the German National Library’s GND’s) and specific biographic background information detailed enough to define who is who in this mess. The system has been working well in its various national boundaries but it was difficult to tell who a specific Thomas Mann was on the BnF’s complementary cataloguing system. It is this riddle that Wikidata has begun to solve. Not only does Wikidata interconnect the up to 300 Wikipedia articles that exist on the various language projects on “the same” entities. The respective Wikidata items will also clarify who these people, organisations and places will be on hundreds of external databases – from the GND to the BnF catalogue.

    Historians should states these references on all data they are producing (wherever available) since this is the only way for anyone using their data to automatically check who is who in the different sets they are merging.

    The easiest thing FactGrid could do is offer simply all the GND items in the basic pool of objects available on the site to link to. Yet the easiest thing will not be the best thing here. As the National Libraries are about to create and to interconnect their own Wikibases we should enter this compound more as a partner than an interested user. “Our” data should profit from corrections made elsewhere in the wider environment. Corrections made on FactGrid should in return enter the global exchange with information about the research that led to these changes.

    We are still living in a world in which DH projects are basically transferring their view of the book world into the new medium of the internet. Books have to be quoted as do web projects – so the common logic, that is creating ever new islands of information on isolated web-platforms.

    The future is not the web project quoted in a book or by another web project. The future is in data ready to be downloaded and used in ever new environments. We will need authority to control data, to ensure that those who use our data know what they have downloaded, and we will need collective platforms to offer data in an environment in which the augmentation and further development of information can take place.

    https://4memory.de/

    It was therefore paramount for us to enter Germany’s present NFDI process. The process is on a trajectory of creating research data repositories in all the fields of the sciences and academic studies – repositories, that will eventually present their data under a broader search engine. We have entered this development as a “participant” of the NFDI’s upcoming 4Memory compound (the compound of the studies that are dealing with historical data).

    Our present consideration is how to balance such an integration as a decidedly international site. We will need an international board of FactGrid Stakeholders since this is what we have become over the last three years: an international platform using a multilingual software in order to interconnect research across the borders.

    Die Absolventen des Gothaer Gymnasiums Illustre/ Ernestinum 1524 – 1882

    Nach den Pfarrern des Gothaer Territoriums (und ihren Ehefrauen, beidseitigen Eltern, Kindern und deren Ehepartnern – insgesamt gut 15.000 Datenbankobjekten) legt Heino Richard hiermit einen zweiten, quer durch diese Gruppe reichenden Datensatz vor: Die Absolventen des Gymnasiums Illustre Gotha/ Ernestinum.

    Primär erfasst sind dabei nach den Listen, die Max Scheider und im Nachtrag Ulrich Lutzkat vorlegten: 4215 Schüler von der Frühphase des am 21. Dezember 1524 gegründeten Gymnasiums bis in den Abschlussjahrgang des Septembers 1882. Von diesen waren uns 872 Schüler bereits bekannt, davon (die Zahlen werden sich ändern, wo immer wir mit den neuen Daten bislang unklare Identitäten auflösen können):

    • 7 aus der Gothaer Illuminatenforschung
    • 21 aus den Gothaer Adressbüchern der Jahre 1828, 1843 und 1846
    • 17 aus dem Gothaer Wählervereichnis von 1849
    • 810 aus dem erwähnten Projekt der Sachsen-Gothaischen Pfarrer

    …wobei die Adressbücher uns nach wie vor vor das Problem stellen, dass wir aus ihnen Personen zwar mit Adress- und Berufsangaben aber weitgehend ohne Vornamen bezogen. Die Identifikation kommt hier nur zäh voran.

    3343 Personen kamen neu hinzu und zogen dabei 279 neue Väter mit sich, macht unter dem Strich 3622 neue Personen (zwei besonders prominente Neuankömmlinge sind der Absolvent Christian Gryphius mit seinem Vater, dem noch berühmteren Dichter, Andreas).

    Die Überlappungen waren ein attraktives Moment des Projektes. Mit jeder von ihnen stabilisierten sich Identifikationen und kamen Hintergrunddaten hinzu, oft zu bislang nur spärlich beleuchteten Personen.

    Mit den folgenden beiden Datenbankabfragen werden alle uns bekannten Schüler aufgelistet (es sind derzeit zwei Handvoll mehr, dank einiger bekannter Schüler, die früher abgingen):

    Geburtsdaten, Herkunftsorte, Familienbeziehungen, besuchte Universitäten, Berufe…

    Wie schon im Fall des Pfarrerbuchs so sind die Daten der Schülerschaft des Gymnasiums Illustre/ Ernestinum, vor alle ein offenes Angebot an die Forschung. Alle erfassten Personen stattete Heino Richard mit Geburtsdaten aus – entweder aus den vorliegenden Quellen oder über eine Rückrechnung (die, wo wir sie vornahmen, durchweg im qualifizierenden Statement zur Genauigkeit der Angabe vermerkt ist; wir gingen dabei von einer 20-Jahres-Differenz als Regelfall aus, das legten die notierten Daten nahe).

    Der Artikel der deutschen Wikipedia zum Gymnasium notiert:

    Im 17. Jahrhundert wurde das Gymnasium durch Herzog Ernst I. von Sachsen-Gotha-Altenburg weiterhin gefördert. Er bot Söhnen verfolgter Lutheraner aus Ungarn, Schlesien, Polen, Russland und Skandinavien Asyl, die am hiesigen Gymnasium lernten. [abgerufen 2021-04-21]

    Das lässt sich nun präzisieren. Skandinavien (sieht man von einigen Dänen ab) erscheint hier nicht, Schlesien und die ehemaligen deutschen Ostgebiete im heutigen Polen sowie, als Randlage, Ungarn jedoch schon (zudem im 19. Jahrhundert auch ein Schüler aus der Karibik). Näher hinein-gezoomt zeichnet sich dann aber das Sachsen-Gotha-Altenburgisch und Coburgischen Territorium ab. Allein 1462 der 4215 Absolventen kamen unmittelbar aus Gotha, die meisten waren „Landeskinder“, Söhne von Amtsleuten und Pfarrern der Dörfer des Territoriums.

    https://tinyurl.com/yezpgqds

    Ausgiebig sind Informationen zu Studiengängen, besuchten Universitäten sowie späteren Berufen notiert. Die folgenden Suchen geben die Daten.

    Universitäre Fächerwahl, Bubble Chart

    Zum großen Reiz von Wikibase-Instanzen gehört, dass man sie gewissermaßen über Ecken durchsuchen kann. Die Frage nach der sozialen Herkunft der Schüler lässt sich damit überraschend zielgerichtet angehen. Unmittelbar sind die Berufe, Bildungswege und Arbeitsverhältnisse der Väter ein Indikator für das jeweilige Elternhaus. Die Mütter sind in der Regel Hausfrauen. Ihr Stand entscheidet sich über den Beruf und die Ausbildung ihrer Väter. Die Fragen lassen sic präzise in die Vernetzung der Information hinein stellen:

    • Familiäre Hintergründe: Berufe der Väter und der Väter der Mütter, Kurzlink

    Konsequent erfasst sind die genealogischen Hintergrundinformationen; sie ermöglichten die Suche über Eck. Langzeitvisualisierungen der familiären Netzwerke wären eine Herausforderung. Hier ist vor allem unklar, wie man Datenvisualisierungen im historischen Verlauf gestalten sollte – eine Herausforderung für SPARQL-Könner und Tool-Programmierer.

    Einladung an die Bildungsgeschichte sich dieses Zettelkastens zu bedienen

    Projekte der Bildungsgeschichte, auf der Suche nach einem ergiebigen Untersuchungsgegenstand sollten hier eine extrem praktische Vorarbeit entdecken. Gothas Gymnasium Illustre/ Ernestinum bietet eine noch weitgehend unerschlossene archivalische Überlieferung von 8,3 laufenden Regalmetern im Thüringischen Staatsarchiv Gotha mit extremer Datendichte – darin finden sich:

    • Dokumente zum Unterricht in den verschiedenen Fachgebieten von Griechisch bis Turnen ab der Frühphase
    • Schulordnungen ab 1641
    • Akten der Lehrer mit Gehaltsinformationen ab 1837 ff.
    • Zeugnislisten der Jahrgänge 1641 bis 1946
    • Informationen über „spezielle Verhältnisse der Schüler“ ab 1837
    • Akten zur Finanzierung des Gymnasiums ab 1772

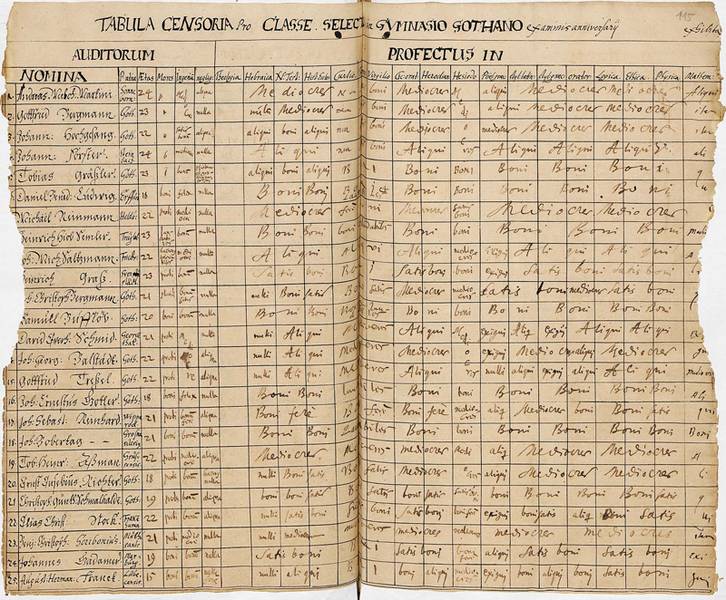
    (Hier das elektronische Findbuch zu diesen Beständen.) Spektakulär sind in diesem Bestand die Zeugnislisten mit ihren Beurteilungen der Leistungen im Wandel der Beurteilungskriterien und Fächer. Aus ihnen wird nebenbei ersichtlich, wie die Schule Unterricht organisierte. Man kann mit diesen Listen im Detail Schülerkarrieren – auch die der Schüler, die nicht bis zum Abschluss kamen und uns bislang fehlen – Schuljahr für Schuljahr nachvollziehen.

    Zeugnisliste des Gymnasiums Illustre aus dem Thüringischen Staatsarchiv Gotha

    Das FactGrid sollte in seinen Datenstrukturen so angenehm frei modellierbar sein, dass es Projekte, die diesen Aktenbestand angehen, anziehen sollte, mit dem Geschenk des fertigen Rasters, von dem aus sich beliebig viel tiefer in die archivalische Datenerhebung einsteigen lässt.


    • Basissuche: einfache Schülerliste: Familienname, Listen-Nummer, GND-ID, Kurzlink
    • Landkartenrepräsentation Geburtsorte der Gothaer Schüler, Kurzlink
    • Besuchte Ausbildungseinrichtungen, Kurzlink
    • Besuchte Ausbildungseinrichtungen, Balkendiagramm
    • Universitäre Fächerwahl, Kurzlink
    • Universitäre Fächerwahl, Bubble Chart
    • Karrieren, Kurzlink
    • Berufliche Positionen, Kurzlink
    • Familiäre Hintergründe: Berufe der Väter und der Väter der Mütter, Kurzlink

    The first volume of the Thuringian pastor’s book (1500–1920) as a Wikibase data set

    auf Deutsch

    In a tremendous effort of a year’s work, Heino Richard of the Genealogical Society of Thuringia e.V., step by step translated the first volume of the Thuringian Pastors’ Books (the volume for the former Duchy of Gotha) into data which we could now feed into FactGrid: More than 13,300 database objects are stemming from this work allowing now entirely new explorations of the territory’s social and religious history. We as curious about the joint ventures this work might inspire. There is no reason to fear that the database version will render all further work on the paper-based volumes obsolete; the platform might, however, offer itself to the editors of the Pfarrerbuch as an unexpected aid.

    The eight volumes cover all the parishes of the former Thuringian territories from the Reformation to the 20th century. A first survey is opening each volume with a tour through all the parishes and offices giving the lists of the pastors and auxiliaries who held the respective offices. The main part is in each volume devoted to the individual biographies. Genealogy is key: Pastor after pastor we get the parents with their professions, their wives (with their respective parents and backgrounds), and eventually the children (with information about their professions and the families they married into).

    “Things, not strings” – database objects instead of names to be merely spelled out

    Translating the volumes into FactGrid-Wikibase data became an ordeal with software’s call for database objects to be connected – where the printed volume was just stating names in various strings of letters. One would have wished to get persistent identifiers with these names since almost all these names reappeared in various contexts – as office holders, as the targets of individual biographies and in various related functions as fathers, sons, sons-in-law or fathers-in-law in the other biographies – without any further clarification of the hard identities behind the mentionings. All this was tricky since names were passed across the whole range from fathers to son, or from grandfathers and uncles to grandsons and nephews to name the closer options that would become most difficult to set apart.

    1953 church dignitaries became the stock to start with – almost all connected to more than one of the 142 parishes. The set doubled, tripled and quadrupled with the wives, parents and children and their new relatives to a total of 13,344 data records (as of today). All the records had to be connected to birth and death dates, places, information about marriages, terms of office and occupations.

    The entire data is still flawed here and there – it will straighten out the the use it will find. A simple check sheds light into the abyss: We still have some 200 personal data records connected to more than one father and one mother. The double records have sprung unto existence wherever we failed to understand that people were the same – a given name missing or an alternative spelling would render the automatic identification impossible. Things are just as tricky where we supposed that we were dealing with a single person whilst we were actually fusing information of two different lives into a single data record.

    Merging data sets remains as painful as the reversal since the software does not take much of an effort to keep track of all the consequences to observe when entire branches of families have been duplicated in the course of the input.

    Software features one would love to have

    The input of genealogical data calls for a module that understands what basically is. The module should generate family trees and warn you before any input that it has found identical family fingerprints: Children from two families are unlikely to share their birthdays; just as they are unlikely to marry into the same families or to share fathers with the same background data. When entering data, the software should highlight congruent structures and help to merge them with look at the entire overlap which it can track far better than any human eye.

    The lack of the stand-alone frontend is even more grievous. Those who want to read the database are not interested in the input pages that list the various triples and qualifiers just as we happened to enter them.

    Magnus Manke’s “Reasonator” and Markus Krötzsch’s “SQID” demonstrate what Wikidata and Wikibase should receive: an interface that is solely geared towards the display of data. The next generation of such interfaces will do more than just display the statements made on a single item in a better order. Configurable interfaces will gather information from items referring to your query. It is precarious to list 800 letters and publications of a person you are exploring on the person’s item, if you have already created 800 items for all these titles all with in-depth information on the authors, collaborators, publishers, performances, recipients, archival holdings and so on. It should suffice to note a person’s father and mother on the person’s item — once you start giving reciprocal information on the parents’ pages and siblings you are in the middle of a mess of data which you will inevitably fail to keep in congruence.

    Lacking a more cohesive interface it remains difficult to present a data set like this one.

    So how can one see what’s in it?

    What we can do in the present situation is to give first searches that enable readers to start their own more specific searches – knowing that SPARQL will be a huge put off for the majority of readers. The most practical first search to start with will be the query for all the Protestant parishes of the former Duchy, to appear on a map:

    Click the red dots to access to the records of the individual parishes with the lists of pastors registered on the each item.

    The table version allows the data to be downloaded as JSON, TSV and CSV data records. TSV, “Table Separated Values”, can be processed in data sheets, whether Excel or Google. The search is sent off with the blue arrow key:

    You will have to study an exemplary personal data record before you start your own searches as you need to know how we formulated the triples, i.e. the miniature statements stored in the database, in order to run effective searches as SPARQL queries:

    The following query generates a table of all pastors with their birth dates, death dates and parents. With the input help (press the i-Icon to activate it) you can add more table columns to the search in order to get the additional information on children, wives, offices, memberships etc.:

    All 13,484 database objects that are using information from the first volume of the Pastors’ Book can be bundled with the P12 (literature) + Q43361 (the first volume of the Thuringian Pastors’ Book) filter.

    What is in it to learn?

    The Thuringian Pastors’ Book genealogical focus opens up a first interesting perspective: Religion becomes after the territorial decisions of the Reformation increasingly a family institution: You take your religion with you as you receive it at birth. This is even more so with the church hierarchy that evolves. Families become the partners of the territorial churches supplying the students of theology and the pastors for generations. With the database we should become able to ask the more specific questions:

    • What was the exact influence of individual family positions: father, mother, grandfathers, uncles? How did that influence accumulate with more than one pastor in the family?
    • Did the family influence on becoming a pastor decrease over time – with the compulsory education becoming the central provider of professional decisions and career options in the course of the 19th century (and when exactly did such an influence become more noticeable)?
    • To what extent was marrying into a rectory household an advantage – for one’s own career, for the careers of the children?
    • Were local networks as valuable as relationships across spatial distances?
    • To what extent did the ecclesiastical appointments open – geographically? Where did the pastors come from over time?

    A project looking for partners

    We will have to bring people and institutions together to make our data sets more accessible and the CC0 license is not the threshold here.

    (1) It would be an immense gain if could get Wikidata and Histropedia people on board. They are the people who understand the technical side far better than the FactGrid community of the historians; and somehow we should become able to work hands in hands.

    (2) It would be a huge win if the resource attracted the team behind the Thuringian pastors books. The software we are using is not really a tool to digest books – it is a tool to facilitate your research. We have the ideal platform one would use to set identifiers and to collect and accumulate information – on the platform with the sources you will not be able to link in the volumes. FactGrid is a team’s tool to be used in the process that prepares a volume.

    (3) We would be pleased if we could win the Eisenach State Church Archives for the project. For two years now we have been working with the Church Archive of the City of Gotha, which has started to use the database as its own repository. It would be exciting to widen this project an to get a clearer picture of the whereabouts of archival materials from the 142 parish we have been exploring with this project.

    (4) A far broader data networking should add complexity and depth to the work done so far: Our 2000 pastors have written sermons, books, and letters. The Gotha Research Library will keep more of these publications than any other institution. We should be able to match our records to fuse the next layer of networking – the layer of public and private networking via letters and publications into the database with its present genealogical focus. The entire production of books and the links to digitisations is now increasingly done by the VD16, VD17 and VD18 online catalogues and the Kalliope-Database. It would be interesting to connect these records to allow the swift step from personal records to online documents. The Gotha Research Centre will not be able to organise such a projects – it will need partners who adopt the work we did here in a pilot study of the database’s potentials.

    If you get interested in the data set and start exploring it, let us know and share your research with us right here on the blog.

    Der erste Band des Thüringer Pfarrerbuchs (1500–1920) als Wikibase-Datensatz

    English Version

    In einer gewaltigen Arbeitsleistung überführte Heino Richard von der Arbeitsgemeinschaft Genealogie Thüringen e.V., Gothaer und Eisenacher Land, im letzten Jahr den ersten Band des Thüringischen Pfarrerbuchs, den Band für das ehemalige Herzogtum Gotha, in eine Version von über 13,300 Datenbankobjekten, die nun ganz neue Auswertungen erlaubt und die vielleicht damit interessante Kooperationen nahelegt. Dass das Datenbankangebot die weitere Arbeit an den Pfarrerbüchern erübrigen wird, steht nicht zu befürchten. Vielleicht aber wird sich das FactGrid den Bearbeitern der Bände als unerwartetes Hilfsmittel anbieten.

    Die bisher erstellten acht Bände erfassen von der Reformation bis ins 20. Jahrhundert alle Pfarreien der ehemaligen Thüringer Territorien.

    In einem ersten Part sind jeweils die Amtsinhaber nach Pfarreien chronologisch aufgelistet. Ihnen folgen im Hauptteil alphabetisch sortiert die eingehenden Biographien mit extensiven genealogischen Vernetzungen. Notiert werden jeweils die Eltern, die Ehefrauen mit Eltern und die Kinder, nochmals mit Hintergrundinformationen über Berufe, Ehepartner und deren Elternhäuser.

    “Things, not Strings!” – Datenbankobjekte statt Namen in Buchstaben

    Was in den acht Bänden nicht so schnell sichtbar wird, wurde in der Bearbeitung für das FactGrid zur harten Herausforderung: Wikibase will mit Datenbankobjekten, nicht mit schlichten Namen befüttert sein. Das Thüringer Pfarrerbuch liefert die Namen mit wechselnden Hintergründen (und immer wieder auch variierenden Schreibweisen), doch an keiner Stelle mit stabilen Identifikatoren; und so tauchen dieselben Person jederzeit für sich genommen und in verschiedensten Biogrammen als Väter, Söhne, Schwiegersöhne oder Schwiegerväter auf, ohne dass sogleich klar wird, wer da wer ist. Mit der Datenbankerfassung musste entschieden werden, wann jemand derselbe war – keine einfache Entscheidung, da Namen keine Eindeutigkeit schufen, familiär weitergegeben von Väter an Söhne wie zu Ehren näherer und fernerer Verwandter.

    Das Datenvolumen lässt das Dickicht erahnen. Auf die 142 Pfarreien, die zwischen 1500 und 1920 im ehemaligen Territorium bestanden, kamen 1953 Personen als zeitweilige Amtsträger. Mit deren genealogischen Geflechten summiert sich der Personenbestand aktuell auf 13.344 Datensätze, die mit Eckdaten zu Geburt, Tod, Eheschluss und Kindergeburten, Amtszeiten und Berufen auszustatten waren.

    Der gesamte Datenkomplex ist noch nicht vollständig konsolidiert. Ein Schlaglicht darauf werfen die Abfragen von Kindern und Eltern: Gut 200 Personendatensätze verfügen derzeit noch über mehr als einen Vater und eine Mutter – Doppelungen zu denen es kam, wenn wir versehentlich unter den Vätern oder Müttern Dubletten anlegten, Datensätze zur selben Person, da erst einmal nicht klar war, dass es sich um dieselbe Person handelte. In anderen Fällen haben Datensätze zwei Mütter oder Väter, da wir bislang verkannten, dass wir hier Biographien hätten trennen müssen – in sie flossen Eltern zweier gleichnamiger, nun zu trennender Personen ein.

    Sowohl das Vereinen von Datensätzen wie das Auseinandernehmen sind Arbeiten, bei denen man schnell den Überblick verliert, da die Software nicht erfasst, wo ganze Äste gedoppelter oder zu trennende Information vorliegen und wie mit ihnen am besten zu verfahren ist.

    Softwaredesiderate

    Für die Eingabe genealogischer Daten wünschte man sich ein Modul, das versteht, was Verwandtschaftsbeziehungen ausmacht, und wie sie in der vorliegenden Datenbank notiert werden. Das Modul sollte Stammbäume generieren und noch im Eingabeprozess warnen, wenn sich familiäre Fingerabdrücke gleichen; es ist unwahrscheinlich, dass Kinder zweier Familien die Geburtstage oder Ehepartner miteinander teilen. Noch bei der Eingabe sollte die Software deckungsgleiche Strukturen aufscheinen lassen und aufzeigen, wie Äste von Information aufeinander zu legen sind.

    Unbefriedigend ist bei alledem, dass wir in einer Software ohne stand-alone-Interface arbeiten. Magnus Mankes „Reasonator“ und Markus Krötzschs „SQID“ zeigten, was Wikidata und Wikibase bislang vor allem fehlt: die allein auf die Datennutzung ausgerichtete Oberfläche. Die weiterführende Technologie wird an selber Stelle viel mehr leisten müssen, als Daten aus einem jeweiligen Item besser geordnet wiederzugeben. Interessant werden konfigurierbare Oberflächen, die die Datenbank befragen, und die es erübrigen, Information in ihr gedoppelt abzulegen. Es ist prekär, im Datensatz zu einer Person, sagen wir, 800 Briefe und Publikationen der Person zu listen, wenn man bereits zu diesen 800 Objekten eigene Datensätze anlegte, die weitaus komplexer über Autoren, Beiträger, Adressaten, Verleger, Aufführungsorte, Aufbewahrungsorte, Werkausgaben, Digitalisierte, Transkripte, Übersetzungen und genannten Personen informieren. Im Moment legen wir Informationen doppelt und dreifach ab, allein um im Blick zu behalten, dass sie in der Datenbank vorliegen – mit allen Risiken dabei auseinander laufender Informationsstände.

    In der misslichen Lage ist die hiermit vorgelegte Arbeit erst einmal fast nur für Datenfachleute klarer lesbar.

    Erste Überblicke und Suchen

    Die vielleicht praktischste erste Suche ist die aller protestantischen Pfarrämter des Herzogtums mit der Darstellung auf der Karte:

    Jeder einzelne Punkt lässt sich anklicken und birgt den Zugriff auf die Datensätze der Pfarrämter und über diese auf die Amtsinhaber in ihrer jeweiligen Folge.

    Die Tabellenversion erlaubt, es die Daten als JSON, TSV und CSV Datensätze herunterzulanden. “Table Separated Values” lassen sich in Datenblättern, ob Excel oder Google Sheets, weiterverarbeiten. Die Suche muss jeweils aktuell mit der blauen Pfeiltaste aktiviert werden:

    Es empfiehlt sich, vor jeder weiteren Erkundung einen exemplarischen Personendatensatz zu studieren, um zu erfassen, welche Informationen von uns wie abgelegt wurden – es ist dies das Wissen, das bei jeder SPARQL-Abfrage zum Einsatz kommt:

    Die folgende Anfrage generiert eine Tabelle aller Pfarrer mit deren Geburtsdaten, Sterbedaten und Eltern. Mit der Eingabehilfe (das i-Icon aktiviert sie) lassen sich beliebige weitere Tabellenspalten zu Kindern, Ehefrauen, Ämtern, Mitgliedschaften hinzusetzen:

    Alle 13.484 Objekte, die den ersten Band des Pfarrerbuchs als Ressource nutzen, lassen jederzeit sich mit der Eingrenzung auf der Literaturangabe bündeln.

    Inspiration

    Der genealogische Schwerpunkt des Pfarrerbuchs eröffnet eine erste interessanteste Perspektive: Religion ist im protestantischen Raum, mehr als im katholischen, Familiensache. Die territoriale Organisation der religiösen Betreuung findet Pfarrfamilien als organisatorischen Partner. Mit der Datenbankerfassung sollten sich die die härteren Fragen stellen lassen:

    • Wie groß war der spezifische Einfluss von Familienpositionen: Vätern, Müttern, Großvätern, Onkeln?
    • Wie veränderte sich dieser Einfluss? Inwieweit schwand er im Prozess, in dem Bildung klarer eine Angelegenheit der Schulsysteme wurde, die Berufswege unabhängig vom Elternhaus zu ebnen suchen?
    • Inwiefern war die Einheirat in einen Pfarrhaushalt ein Vorteil – für die eigene Kariere, wie die der Kinder?
    • Waren räumlich nahe Vernetzungen gleich viel wert wie Beziehungen über räumliche Distanz hinweg?
    • In welchem Umfang öffnete sich die kirchliche Ämterbesetzung im Verlauf? Wo kamen die Pfarrer her, wie verlagerten sich Herkunftsschwerpunkte?

    Projekt auf Partnersuche

    Vor allem wird nun die Frage interessant, welche Benutzergruppen wir in Austausch miteinander bringen können.

    (1) Ein immenser Gewinn wäre es, könnten wir Geschichtsinteressierte des Wikidata-Projektes und der Histropedia auf den für uns noch durchaus unhandlichen Datenschatz lenken. In beiden Bereichen halten sich die Nutzer auf, die die Technik erst einmal weit besser verstehen als die FactGrid-Community der derzeit etwas über 100 Historiker und Historikerinnen.

    (2) Interessant wäre es, das nach wie vor am Thüringer Pfarrerbuchs arbeitende Team für das FactGrid zu gewinnen. Unsere Datenbank sollte sich vor allem als immenser Zettelkasten eignen, in dem sich Informationen ablegen und mit den jeweils aktuellen Quellenbelegen ausstatten lassen.

    (3) Freuen würden wir uns, gelänge es uns, das Landeskirchenarchiv Eisenach näher an das Projekt zu binden. Seit gut zwei Jahren arbeiten wir mit dem Kirchenarchiv der Stadt Gotha zusammen, das seinen Aktenbestand im FactGrid verwaltet. Spannend wäre es, zu erfassen, welche Datenbestände aus allen 142 Pfarrämtern heute noch wo liegen. Es ist dies ein im Kirchenarchiv Eisenach soeben koordiniertes Projekt.

    (4) Die breite Datenvernetzung wird die bis hierhin getane Arbeit mit Vielschichtigkeit ausstatten: Die von uns erfassten Personen schrieben Bücher und Briefe. Die Forschungsbibliothek Gotha wird von den Publikationen ihres Territoriums mehr als jede andere Institution aufbewahren. Wir sollten hier den wechselseitigen Informationsabgleich zu Wege bringen. Der Abgleich mit dem VD16, VD17 und VD18 und der Kalliope-Datenbestand würde es erlauben, die Datensammlung an die laufende Erschließung von Texten und Dokumenten anzuschließen. Zur genealogischen Vernetzung der Biogramme käme im selben Moment die Vernetzung der jeweiligen öffentlichen Interaktion und persönlichen Korrespondenz. Für die Forschung dürfte es attraktiv sein, mit den Datensätzen Zugriff auf die Digitalisate zu gewinnen, und zu den Personen Texte und Austausch unmittelbar verfügbar vorliegen zu haben.

    Wir sind neugierig darauf, wie sich das vorgelegte Datenangebot entfalten wird, und laden dazu ein, Erkundungen der Datensätze noch hier im Blog mit uns zu teilen.