Introducing GT-Viz: Visualize FactGrid Data on a Map

GT-Viz is a browser-based tool for visualizing geospatial and temporal data from SPARQL endpoints. You write a SPARQL query, provide the SPARQL endpoint for example FactGrid or Wikidata, and the results appear on an interactive map with a timeline.

It was built by a group of students at RWTH Aachen University as part of the Knowledge Graph Lab course.

Try it here: https://gtviz-kgl.wikidata.dbis.rwth-aachen.de/tutorial

Input

The only input needed is a SPARQL query. A set of built-in example queries covers FactGrid (Thirty Years’ War battles), Wikidata (Napoleon, WW1 & WW2, Magellan and Columbus voyages, Olympic venues), and can be loaded for testing the functionalities. The sidebar holds a SPARQL editor with syntax highlighting and validation. A Help panel documents the expected query variables.

The tool reads these variables from your query results: ?location (WKT point), ?time (date), ?category, ?parentCategory, and optionally ?name, ?description, and ?pathId.

Map View

Query results appear as markers on an OpenStreetMap base layer. Parent categories each get a distinct color; sub-categories within a parent are separated by fill patterns. Clicking a marker shows its name, description, category, and date.

Two display options can be toggled: whether to draw connecting lines between points that share a ?pathId, and whether to show points that have no date.

The Group Visibility panel shows the full category hierarchy from the query results. Individual sub-groups or entire parent categories can be toggled on or off. Item counts are shown at every level.

Timeline and Animation

The timeline at the bottom filters the map to a selected date window. Drag the handles to set start and end dates; the map updates immediately. The Play button animates the window forward through time at an adjustable speed (configurable in days, weeks, months, or years per second).

Historic Map Overlays

As an experimantal feature it is possible to load historic maps. The historic maps are overlayed on the base layer as they only cover a small portion of the globe. For testing we provided a small set of over 20 different historic maps. Only thing needed to integrate such a historic map is a tile server serving the map thus the set of supported historic maps can easaly be extended.

Example: Thirty Years’ War battles from FactGrid

    1. Open https://gtviz-kgl.wikidata.dbis.rwth-aachen.de
    2. Click the lightbulb icon and select “FactGrid: Battles of the Thirty Years’ War” — the endpoint and query fill in automatically.
    3. Click Run. Battles appear across central Europe; the timeline sets itself to 1618–1648.

From there, use the Play button to step through the war year by year, the filter panel to isolate specific belligerents, and the Map Config tab to add a period map beneath the markers.

Feedback

GT-Viz is a student project in its early stages. We are looking for feedback from the FactGrid community on what works, what is missing, and what would be most useful.

Take the survey

Continue reading “Introducing GT-Viz: Visualize FactGrid Data on a Map”

ddpp | Ein Datensatz deutscher politischer Parteien

Der hiermit vorgelegte Datensatz zur deutschen Parteiengeschichte dürfte – mit aktuell 873 gelisteten Parteien – im Moment der umfassendste seiner Art im Internet sein: Frei nutzbar, in beliebiger Konfiguration herunter zu laden, in Hintergrunddaten ausgreifend und zudem (mit einem frei erhältlichen FactGrid-Konto) unter beliebigen Forschungsinteressen auf die eigenen Bedürfnisse hin bearbeitbar.

Zum Vergleich: 59 aktive und 35 historische Parteien notiert der Datensatz des GBV zum Thema mit dem Angebot extrem unhandlicher Identifikatoren und ohne sehr viel tieferen Informationsgehalt. Wikidata überholte Projekte wie dieses in den letzten Jahren – allerdings auch immer wieder mit dem Nachteil, dass die dabei entstehenden Datensätze nicht so recht geplant waren und damit so einfach nicht zu handhaben sind. Die deutschen Parteien in Wikidata sind über keine einheitliche Recherche zu erfassen; es ging hier nicht darum, einen gleichmäßig ausgestatteten wie vollständigen Datensatz herzustellen. Einzelne, voneinander nicht informierte Eingaben akkumulierten sich hier eher planlos. Bewegt man sich in der Gegenwart, sollte man die Liste zu Rate ziehen, die die Bundeswahlleiterin 2024 vorlegte: Ausgewählte Daten politischer Vereinigungen, Stand 31.12.2023 (Wiesbaden, Juli 2024). Mit 637 Einträgen für die Jahre 1969 bis 2023 ist sie die dichteste Sammlung zur Parteienlandschaft der letzten 50 Jahre. Jede einzelne Partei ist hier mit Eckdaten aus der Buchführung der Wahlleitung versehen. Wikidata, in der quantitativen Erfassung wie in der Stringenz unterlegen, gewinnt an ganz anderen Stellen in der Vernetzung etwa mit Personen: Gut 15.000 Personen sind in Wikidata als Mitglieder mit der NSDAP verbunden, wohl weil die Informationen aus entsprechenden Wikipedia-Artikeln zur Verfügung standen. Wikidata bietet Serien von Mitgliederzahlen, externe Identifikatoren aus anderen Datenbanken oder Informationen zu Wahlen, in denen diese Parteien antraten.

Der vorliegende Datensatz ist genetisch ein Amalgam aus beiden Quellen und, gezielt als Partei-Datensatz angelegt, auf Homogenität hin gestaltet. Der Datensatz der Bundeswahlleiterin lässt sich dabei mit all seinen Eckdaten isolieren. Gleichzeitig reicht der vorliegende Datensatz dank Wikidata bis in die Frühphase des deutschen Parlamentarismus der vor der Reichseinigung stehenden Länder hinab.

Die gelisteten Parteien sind geschlossen mit einem Projekt-Item als zum „ddpp-Datensatz“ gehörige isolierbar, sie lassen sich gleichzeitig beliebig filtern (etwa um nur Parteien der BRD oder der DDR zu erfassen) oder ausdehnen: etwa im Blick auf historische Eckdaten, Organisationsbeziehungen, Parteiprogrammatiken oder involvierte Personen.

Statt einer einfachen Definition – Angebote, Definitionen selbst vorzunehmen

Der vorliegende Datensatz verfügt über kein klares Definitionskriterium und das sollte als Vorteil notiert sein. Man selbst kann ihn streng definieren oder öffnen, um etwa auch „Listen“, „Wahlgemeinschaften“ oder prominente „Orts-“ und „Landesverbände“ zu erfassen. Das ist sinnvoll schon allein, da sich aus all diesen auf Wahlzetteln auftauchenden Organisationsformen Parteien entfalten können, die am Ende bundesweit auftreten und sich im Parteiengefüge etablieren (wie dies etwa die Grünen taten). Die FactGrid-Datenbank hat kein Zentrum. Würde jemand NSDAP-Ortsverbände zu seinem Thema machen, wären diese das Zentrum seines Datensatzes und die Parteienlandschaft der Weimarer Republik nur der unüberschaubare Rand.

Die Problemlag wird mit der Frage nach dem Gründungsdatum der SPD im Detail greifbar: Der vorliegende Datensatz bietet tatsächlich vier Gründungsdaten mitsamt den Gründen, die sie im Einzelnen nahelegen. Es handelt sich bei drei der Datierungen um Gründungsdaten von Parteien, die die SPD als historische Wurzeln beansprucht. Wenn man diese Daten den einzelnen Vorgängern zuordnet, ist das Jahr 1890 mit dem Erfurter Gründungskonvent das allein der SPD zuzuordnende Gründungsdatum (und darum hier hochgewertet):

Der FactGrid „Datensatz zu deutschen politischen Parteien (ddpp)“ lebt in dieser Vielschichtigkeit der Möglichkeiten von seinem Angebot, ihn unterschiedlich zu fassen. Mit ihm sollte vor allem durchdacht werden, wie man sich dem Problem besser als mit einer Definition nähert. Die Antwort lautet: durch den beliebig umfassenden Datensatz, der jederzeit die Verlagerung und Verengung des Blickwinkels erlaubt.

Den ddpp-Datensatz praktisch nutzen

Der vorliegende Datensatz sollte es möglich machen, alle gelisteten Parteien eindeutig voneinander abzugrenzen und im komplizierten Fall direkt miteinander in Beziehung zu setzen: Es gibt in der Tat einen Unterschied zwischen WiR2020 (Q1182789) und Wir2020 (Q1211961); er liegt ostentativ im kleinen r, das Wir2000 als Erkennungsmerkmal beansprucht. Im spezifischen Datensatz wird klarer, dass die Partei mit dem kleinen r eine Abspaltung von und eine Kampfansage gegenüber der Mutter mit dem großen R ist. Die Q-Nummern erlauben es, die Unterschiede den Notizen in den Datensätzen zu überlassen. Im Datensatz sind im selben Moment Übersetzungen (aktuell englischer, französischer und spanischer Sprache) im Angebot sowie Verlinkungen zu Wikidata, zur GND, zur Publikation der Bundeswahlleiterin und zu Wikipedia-Artikeln, die mehr Informationen bieten.

In der praktischen Nutzung sollte jeweils der spröde „Basisdatensatz“ im Zentrum stehen, der es erlaubt, beliebig zu filtern wie beliebig zu erweitern. Im Basisdatensatz erscheint jede Partei nur einmal mit ihrer ID und kurzem Identifikationsangebot:

Die einzelnen Listen lassen sich nun beliebig erweitern, wobei Parteien in den dabei entstehenden Tabellen mitunter mehrere Zeilen erhalten, zum Beispiel, wenn mehrere GND-Nummern in der diesbezüglichen Spalte zu notieren sind.

  1. Datensatz: Die Parteien mit (soweit vorhanden) externen Identifikatoren: Wikidata, GND, Liste der Bundeswahlleiterin für die Jahre 1969 bis 2023 chronologisch nach Gründungsdatum sortiert.
  2. Datensatz: Die (Um-)Bennungen mit Datierungen. Diese Abfrage ist besonders nützlich in automatisierten Matching-Prozessen, da sie in ihnen Namensvarianten, die sich in Quellen finden, zur Verfügung stellt.
  3. Datensatz: Deutsche Parteien, die zwischen 1969 und 2023 bei der Bundeswahlleitung gelistet waren nach den Ausgewählten Daten politischer Vereinigungen, Stand 31.12.2023 herausgegeben von der Bundeswahlleiterin (Wiesbaden, Juli 2024), mit den dortigen Eckdaten und den Informationen zu respektiven Herausnahmen aus der Aktenführung.
  4. Datensatz: Von welchen Parteien spalteten sich welche Parteien ab?
  5. Datensatz: Alle Parteien, von denen die Bundeswahlleiterin soeben Unterlagen bereitstellt (aktuell 107)
  6. Datensatz: In welchen Parteien gingen die gelisteten auf?
  7. Datensatz: Ideologische Positionierung
  8. Datensatz: Politische Programmpunkte

Die letzten Suchen waren nurmehr punktuell mit Information bestückt; hier wartet der Datensatz im Moment auf Projekte, die in die Tiefe gehen. Eingehendere Suchen ließen sich zu Initiatoren, Gründungsmitgliedern, Parteivorsitzenden bieten, abermals jedoch im Moment nur punktuell.

Wahlergebnisse visualisieren

Seine zentrale Funktionalität entfaltet der Datensatz deutscher politischer Parteien, sobald man ihn im Rahmen des strukturell ganz anders gelagerten (und bis jetzt nur in punktuell vorliegenden) der Wahlergebnisse aller Reichstags- und Bundestagswahlen laufen lässt. Hier die letzte Reichstagswahl vom März 1933, wie sie in der SPARQL-Suche generiert wird und direkt mit den Datensätzen des Projektes kommuniziert:

Reichstagswahl 1933 Bubble Chart

Das FactGrid Datenmodell weicht hier vom Wikidata-Datenmodell ab. Statt auf verschiedene Properties ist hier auf eine einzige gesetzt, die die diversen Zählergebnisse (Erststimmen, Zweitstimmen, Parlamentssitze und Prozentanteile) aufnimmt und unter den Einheiten notiert – das ist praktisch, da sich nun beliebig verschiedenartige Ergebnisse anbieten lassen:

Man kann bei dieser Modellierung an drei Stellschrauben im SPARQL-Skript drehen:

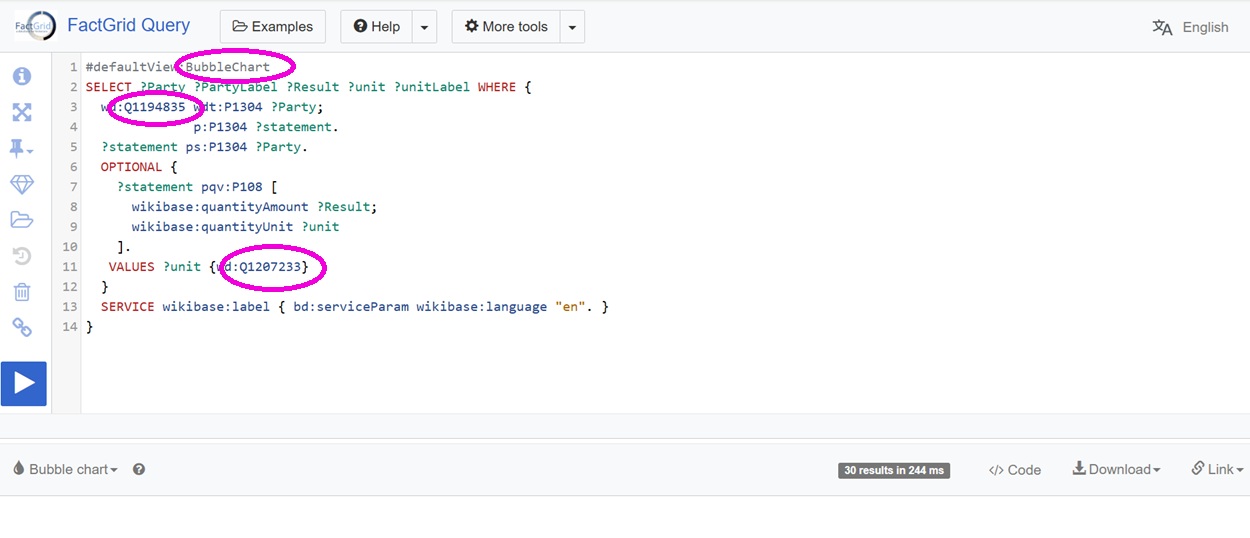
SPARQL-Code für Visualisierung von Wahlergebnissen. Zeile 1: Form der Visualisierung, Zeile 3: die Wahl, deren Ergebnis Visualisiert werden soll (z.B. Bundestagswahl 2025), Zeile 11: Ergebnisaspekt (was dabei gezählt werden soll) etwa Zweitstimmen.

Die FactGrid-Datenlage zu Wahlen ist im Moment noch sehr unvollständig. Wie weit sie gediehen ist, findet sich auf der Projektseite in FactGrid laufend aktuell notiert. Hier ging es erst einmal um eine Realisierung, die handwerkliche Probleme der unterschiedlichen Wikidata-Modellierungen in den Griff kriegt.

Der vernetzte Datensatz

Anders als konventionelle Datensätze sind Wikibase-Datensätze fast immer komplex vernetzt, und das durchaus unüberschaubar.

Die banalste Vernetzung des vorliegenden Datensatz geht von den FactGrid notierten Personen aus:

  • Datensatz: Alle FactGrid-notierten SPD-Mitglieder (283 mit Stand vom März 2024)
  • Datensatz: Alle FactGrid-notierten NSDAP-Mitglieder (1559 mit Stand vom März 2024)
  • Datensatz: Alle FactGrid-notierten Personen, die sowohl in der SPD wie in der NSDAP Mitglieder wurden (21 mit Stand vom März 2024)

Die drei Mustersuchen zeigen, dass wir hier theoretisch sehr komplexe Fragen stellen können, etwa nach der Ausbildung von erfassten Parteimitgliedern oder nach Personennetzwerken, die sich etwa über Mitgliedschaften in Logen oder Studentenverbindungen ergaben. Der Vorteil des FactGrid-Datensatzes ist hier erneut, dass er kein Zentrum aufweist. Es ist möglich, laufend neue Aspekte des jeweiligen Interesses zu formulieren und diese danach aus ganz unterschiedlichen Zusammenhängen heraus zu erfassen.

Extrem komplex sind erwartungsgemäß die organisatorischen Vernetzungen der NDSDAP, setzte hier doch eine Partei systematisch staatliche Organisationsstrukturen außer Kraft, um diese danach mit Parteistrukturen wie denen der SS zu ersetzen. Der ddpp-Datensatz bildet dies gerade im Ansatz ab.

Der für die Weiterverwendung offene Datensatz

Jede der im Vorangegangenen angebotenen Mustersuchen lässt sich modifizieren und alle Ergebnisse lassen sich jeweils in verschiedenen Datenformaten (JSON, CSV, TSV, HTML) herunterladen. Am rechten Rand der Tabellen und Visualisierungen bietet stets ein Mouseover-Menü die verschiedenen Formate wie Bearbeitungsoptionen an. Die Daten sind samt und sonders CC0-lizensiert und damit komplikationslos auch ohne Zitat der Quellen in Grafiken verwendbar.

Interessant sollte es sein, Bearbeitungen des Datensatzes auf der Plattform selbst vorzunehmen, so dass andere Nutzer vom Wissenszuwachs direkt profitieren – vor allem aber auch mit dem Vorteil, dass das eigene Projekt an dieser Stelle nicht von vorne anfangen muss und Fragen nach der eigenen Nachhaltigkeit der kollektiven Arbeitsumgebung überlassen kann.

Einige klar benennbare Desiderate seien neben dieser grundsätzlichen Einladung, sich den Datensatz auf der Plattform anzueignen, ausgesprochen: Die Aufstellung der Bundeswahlleiterin erwies sich als überaus nützlich im Angebot harter Klarheiten. Ein enormes Desiderat wären jedoch Verlinkungen zu Digitalisaten der Unterlagen, die die Parteien vorlegten, sowie Notate der Personen, die diese Parteien gründeten und der Adressen der Anmeldungen. Es ist dies ein Desiderat vor allem im Blick auf die kleinen Dateien, die oft nach wenigen Jahren der Inaktivität schon wieder aus den Akten verschwanden und heute nicht einmal über Internetseiten, die sie lancierten sichtbar sind.

Im Historischen Datenzentrum Sachsen-Anhalt, das das Projekt Rahmen des R:hovono-Projektes initiierte, werden wir eine GND-Situierung des Datensatzes anstreben.

Gut wäre es, die Datenbankobjekte mit Expertise zu Positionierungen, Zielsetzungen, statistischen Daten und vor allem mit Quellverweisen, angereichert anbieten zu können.


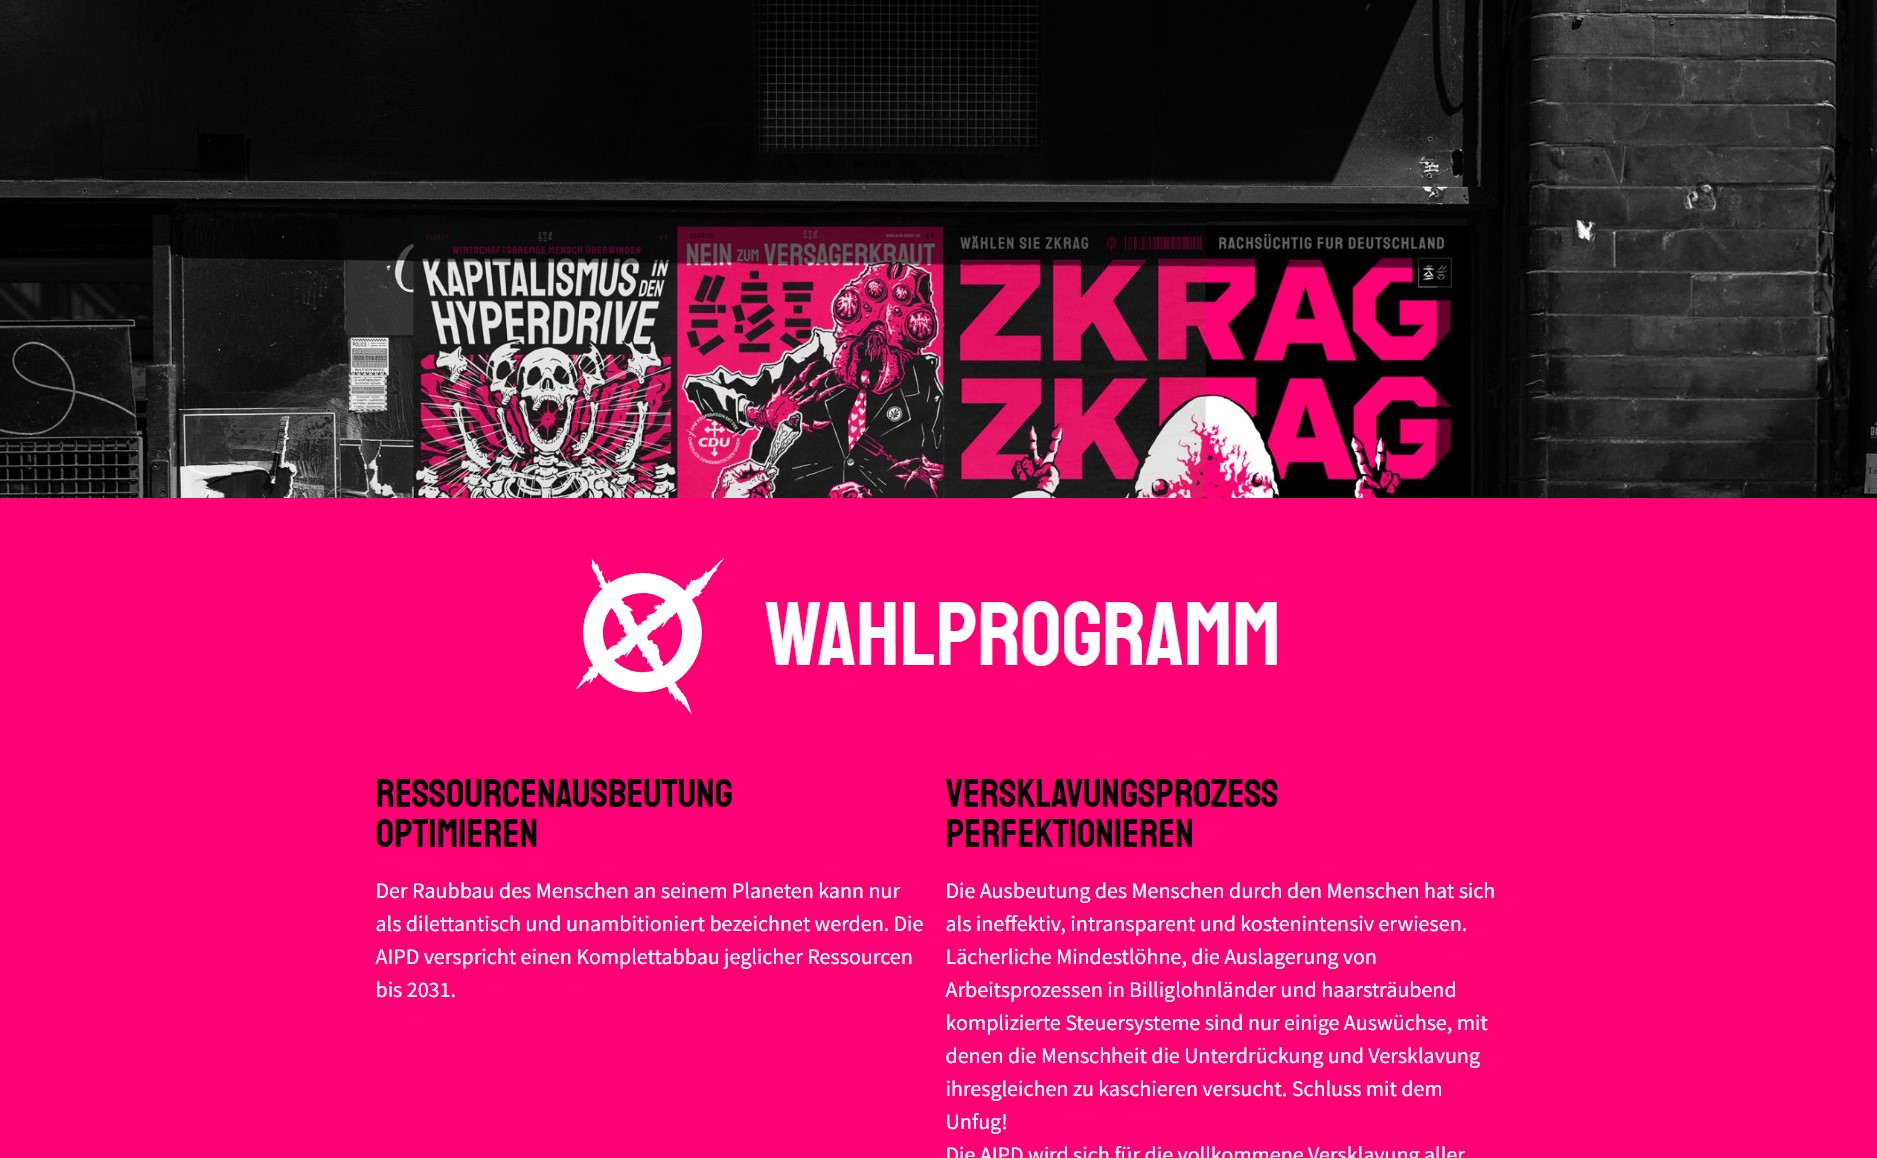
  • Featured Image: Wahlwerbung der AIPD, die wohl eher zu den Kunstprojekten zu rechnen ist, und darum ein gesondertes FactGrid-Item hat. Screenshot der Website https://aipd-partei.de/

Factgrid Federated: How to retrieve data from Wikidata and DBpedia from the Factgrid SPARQL endpoint

Unfortunately becoming an official source for federated {something missing} from Wikidata is not as easy as one writing Factgrid on a waiting list. More over the time perspective seems in unclear. {Gib mir den Absatz auf Deutsch…}

{Auch der nächste Satz, sags mir auf Deutsch und ich sags auf Englisch…} But: Becoming Factgrid becoming a starting point for federated queries to Wikidata and DBpedia is much easier. Thanks to Lucas Werkmeister from Wikimedia Deutschland the Factgrid SPARQL endpoint is now able to request data from Wikidata as well as DBpedia, the linked open data generated from Wikipedia articles.

So Factgrid is now not an isolated database anymore, but integrated in the linked open data universe. An easy example: Every Factgrid item that has a Wikidata QID can be queried for property-value statements from the both Wikidata and DBpedia.

How does it work? Let me explaint it quickly:

Use Prefixes as a gateway to other data sources

The main difference {between what and what?} is that you have to take into consideration the data sources with prefixes at the top of your query. A prefix is basically a signpost or gateway to other ontologies and data sources and must be included at the top of queries.

Since Factgrid uses the same software as Wikidata, the default it to use the prefix wd for items and wdt for properties in Factgrid, which is the default for Wikidata, hence the wd. This works fine if only one data source is used.

Integrating Wikidata in Factgrid queries, it makes sense to change the prefixes in such a way the data source is visible at first glance. I decided to use fg_ for Factgrid, wd_ for Wikidata and db_ for DBpedia. Of course, you can use any other prefix as signpost, like factgrid_item as long as you declare it as a prefix at the top, e.g. `PREFIX fgfactgrid_item: <https://database.factgrid.de/entity/>.

Possible prefixes:

# Factgrid
PREFIX fg: <https://database.factgrid.de/entity/>
PREFIX fgt: <https://database.factgrid.de/prop/direct/>
# DBPedia Categories
PREFIX dbc: <http://dbpedia.org/resource/Category:>
# dbpedia ontology
PREFIX dbo: <http://dbpedia.org/ontology/>
# dbpedia resource
PREFIX dbr: <http://dbpedia.org/resource/>
# Wikidata Prefixes
PREFIX wdt: <http://www.wikidata.org/prop/direct/>
PREFIX wd: <http://www.wikidata.org/entity/>
# standard prefixes
PREFIX owl: <http://www.w3.org/2002/07/owl#>
PREFIX dct: <http://purl.org/dc/terms/>

Structure of federated queries

There are many to Rome and to federated queries. The ones I generated so far have the follwing basic structure:

  • set the prefixes
  • look up a specific item in Factgrid named fg_item
  • look for the Wikidata QID of the Factgrid item and convert this string it to an IRI called wd_item in order to use it for quering Wikidata or DBpedia
  • get the item in DBpedia using the OWL ontology with that specific Wikidata QID ?db_item owl:sameAs ?wd_item
  • define properties that are of interested as [VALUES](https://www.wikidata.org/wiki/Wikidata:SPARQL_tutorial#VALUES) and give them a name, e.g. relations_db
  • get the resulting value

Examples for federated queries

Magnus Hirscheld partners

Time for an example. Let’s search for unmarried partners of the famous German sexologist Magnus Hirschfeld in Factgrid, Wikidata and DBpedia. The query behind this link looks up the specific properties for unmarried partners in all three sources and delivers the name as well as an image. The technical parts included as comments.

As you can see, there are three lines. One is empty, it’s the first data source, Factgrid, that has nothing to offer for that request. The second row is from DBpedia, because the _db columns are filled, the first is from Wikidata (_wd) .

So there are two partners in those three data sources: Karl Giese in DBpedia and Li Shiu Tong in Wikidata. Both are correct, but neither Wikidata nor DBpedia have all information. Just by combining the sources we get the full picture.

A note on property Labels: I don’t know yet how to include both property labels from two sources (Factgrid and Wikidata), because both rely on the PREFIX wikibase: <http://wikiba.se/ontology#>.

Get all persons that are mentioned in a Factgrid item’s Wikipedia article and show their image

Like before, the example is Magnus Hirschfeld.

Link to the query

A tool to make mass comparisons

Relying on these query mechanisms I built a tool to compare Factgrid and Wikipedia statements in bulk. I make use of Factgrids P343, that offer the translation between Factgrid and Wikidata properties. In the first iteration of the app, it only works for properties relating to people.

The goal is to find missing relations on both Factgrid and Wikidata and create triples automatically that can be imported to Wikidata or Factgrid, including a source and timestamp.

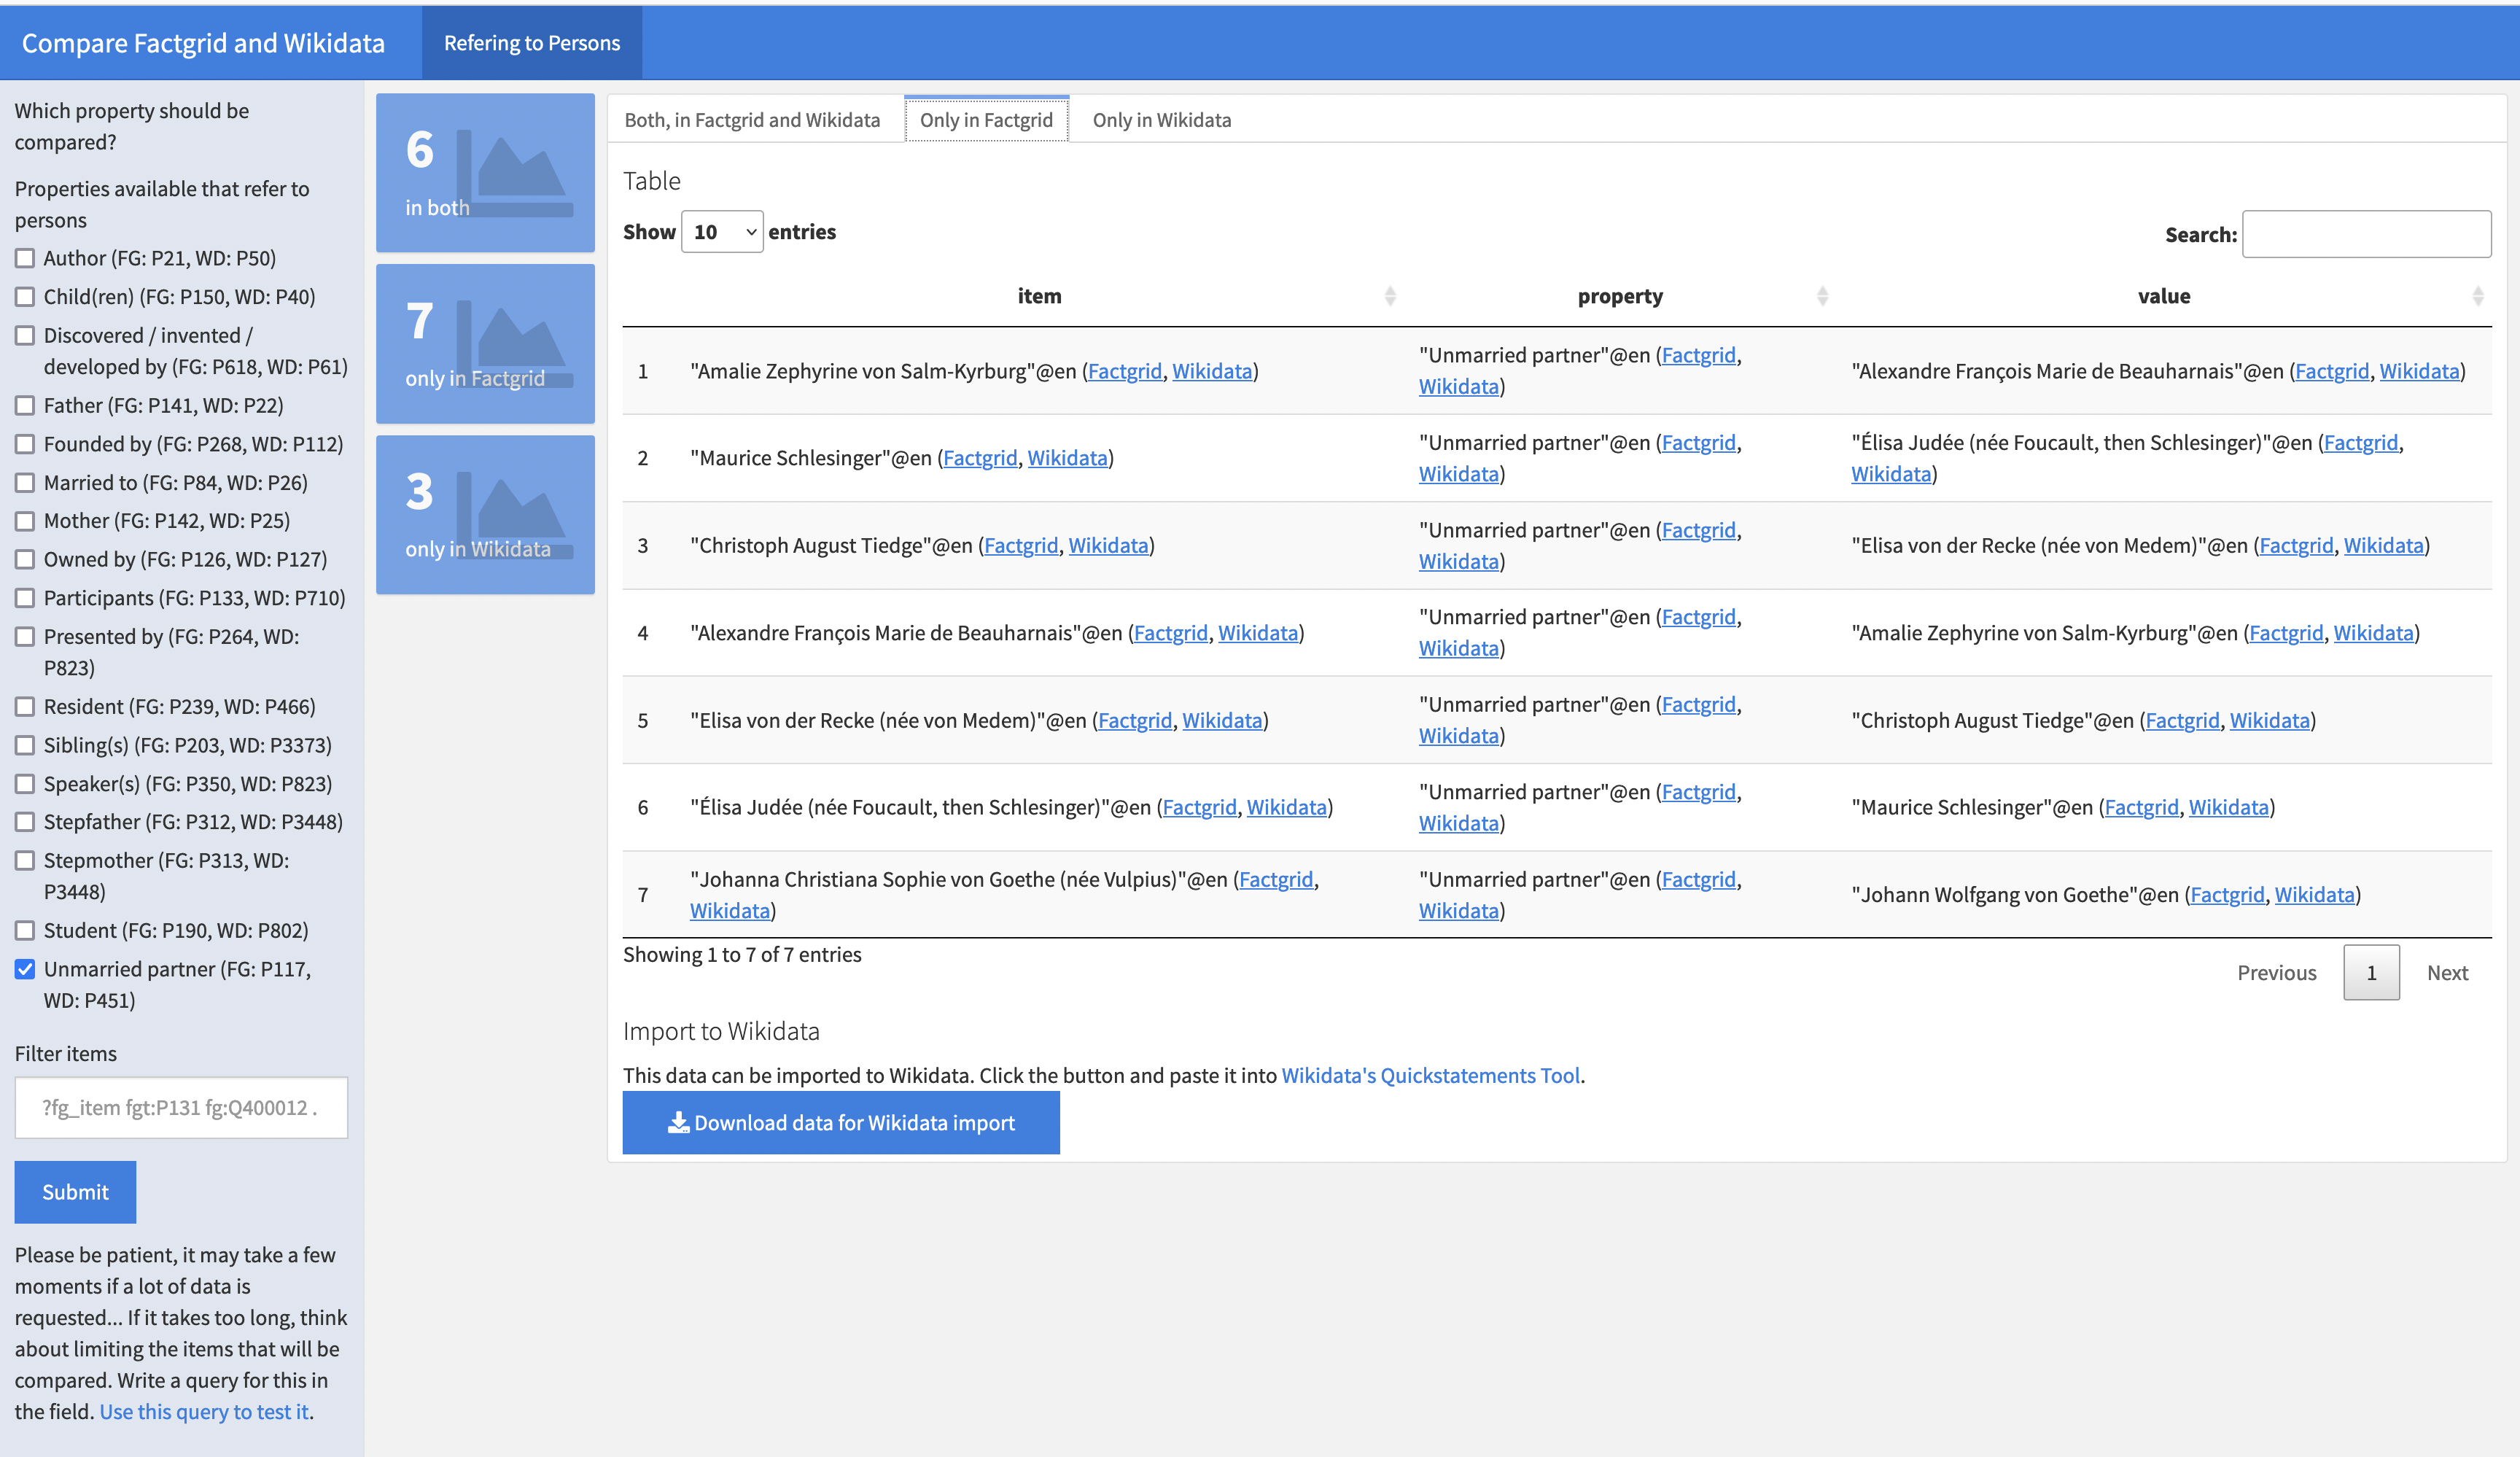
For example, Factgrid’s Property for unmarried Partner is P117 and it’s corresponding Wikidata property P451 is entered on Factgrid. This let’s us search for all Factgrid Items that have a Wikidata QID and compare the partners on Factgrid with the partners on Wikidata.

As of today, June 27, 2022, there are six relations that are both in Factgrid as well as Wikidata. For example, that Lida Gustava Heymann was Anita Augspurg’s partner can be found on Factgrid and Wikidata.

Seven statements are only in Factgrid, but not in Wikidata, e.g. that Amalie Zephyrine von Salm-Kyrburg’s partner was Alexandre François Marie de Beauharnais. Since both, Salm-Kyrburg and de Beauharnais have a Wikidata QID in Factgrid, we can automatically build the import statements for Wikidata Quickstatements Tool. You get those import statements when you click “Download data for Wikidata import”. Copy the content of the downloaded file and paste it into the Quickstatement Tool. Besides the statement, it includes a source and timestamp.

It works the other way, too. There are three unmarried partnerships of Factgrid items in Wikidata, that Factgrid has not covered. One might want to have those statements in Factgrid as well and with downloading the file and importing it with Factgrids Quickstatements Tool it can be easily included in Factgrid’s data.

But this only works for items that already exist in Factgrid. You can detect them, when the column value looks like Factgrid, Wikidata. If there’s only value = Wikidata then it cannot be imported straightahead, because it only exists so far only in Wikidata. This is the case for Anne Louise Germaine de Staël’s partner Louis Marie de Narbonne-Lara in row 1. So even we the tool detects three partnerships in Wikidata missing in Factgrid, only two can be imported quickly.

In contrast to the tables showing the statements in both data sources and the statements only in Factgrid, there are no labels, just links for the values. It would be possible to fetch them from Wikidata, but it would take quite a time load them. In favor of loading time this information is missing.

It might be the case that you are only interesed in a certain subset of Factgrid items. Then you can add a filter in the text field on the left sidebar.

Try it yourself

The link to the app is apps.katharinabrunner.de/compare-factgrid-wikidata/. Try it yourself, I am looking forward to your feedback!

Soon, I want to extend the app such that it works on all other properties as well that allow a comparison between Factgrid and Wikidata.

Want to know more about federated queries?

The technical documentation of Wikidata is excellent and offers many, many examples. A starting point for federated queries can be found here.

Imagine a Graph Query Helper for Graph Databases

[Link für Deutsche Übersetzung]

FactGrid is a graph database. If you run searches in such a database you should rather not think of a resource filled with interrelated tables (of people, places, organizations, documents…) – but of something more spatial, more geometric, more graphic.

Think of your own knowledge. You will not be able to give a table of all the names that have a meaning in your knowledge, or of all the places related to these names. Our knowledge is more like a web of interrelated objects. Nicolaus Copernicus? He is the man who wrote De revolutionibus. What else do you know? Maybe that he was born in Thorn, Polish Toruń, and that he studied at the Universities of Padua and Bolognia. I at least do not immediately know much more about the author who brought about the “Copernican Revolution”. That, of course, is an object that rings many more bells, with all the connections to other items of knowledge it has in my knowledge. I can add that these two universities were good places to study those subjects that were to become the natural sciences – but that again is knowledge on these objects, not on Copernicus, knowldge that got stuck in my knowledge as it added some more colour to my knowledge about Copernicus, the person. Think of interrelated objects hanging together in the wider mesh of your knowledge – of objects that link to each other like atoms in a molecule.

…an object with links to two other objects? That could be someone linked to her two parents. The graph would not look different if that was another person with his two daughters, or Copernicus with links to the two universities mentioned. Well, Copernicus studied at four universities, to be precise – but that is not the problem.

The problem is that the molecular model does not carry particularly well as it puts all the differences into the atoms, hence the various colours in images and the different connectivities of atoms in the typical three dimensional tool kits. In a database like FactGrid all the objects are structurally completely identical. They all are just “Items”: meaningless points, “nodes”, under Q-numbers counted up from 1 to infinity. The various and very specific Properties between the objects make all the differences in a graph database: “Fathers” are in FactGrid Items that have P141 “father” properties referring to them; mothers have P142 Properties linking from other items towards them.

In a triple-based database (which breaks down all knowledge into three-part statements) we will need no more than two sorts of components: You can take spheres for the objects of our knowledge, the “Items”, and arrows for the links that run between them – arrows as we have to express directions in the various statements.

Those who studied at the University of Jena have P160 “educating institution” statements leading from their Items to the University of Jena Item Q21880. This is the SPARQL script (see this link to see what it does):

SELECT ?Item ?ItemLabel WHERE {
   SERVICE wikibase:label { bd:serviceParam wikibase:language “[AUTO_LANGUAGE],en”. }
   ?Item wdt:P160 wd:Q21880.}


SPARQL is a wonderfully versatile language to send searches through graph databases but it is impossible to script even this most simple query without handbook knowledge. What is worse: You will need additional knowledge of our database to know that Jena’s University has this the Q-number Q21880 and that students must have P160 statements on them that will link to this University with the Q21880 indetifier.

The Wikimedia Query Helper is the coolest gadget as soon as you understand what a “Filter” can do for you in your query. Once you realise that this is the input field that will need the university in your specific query you can start to type “Univ…” and the autocomplete will lead you to the Q-number you are looking for. Select the Item you are interested in and the tool will already propose the “who studied here?” Property P160 as this is the most used Property leading to Q21880. It is fair to assume you are looking for people who studied at this university.

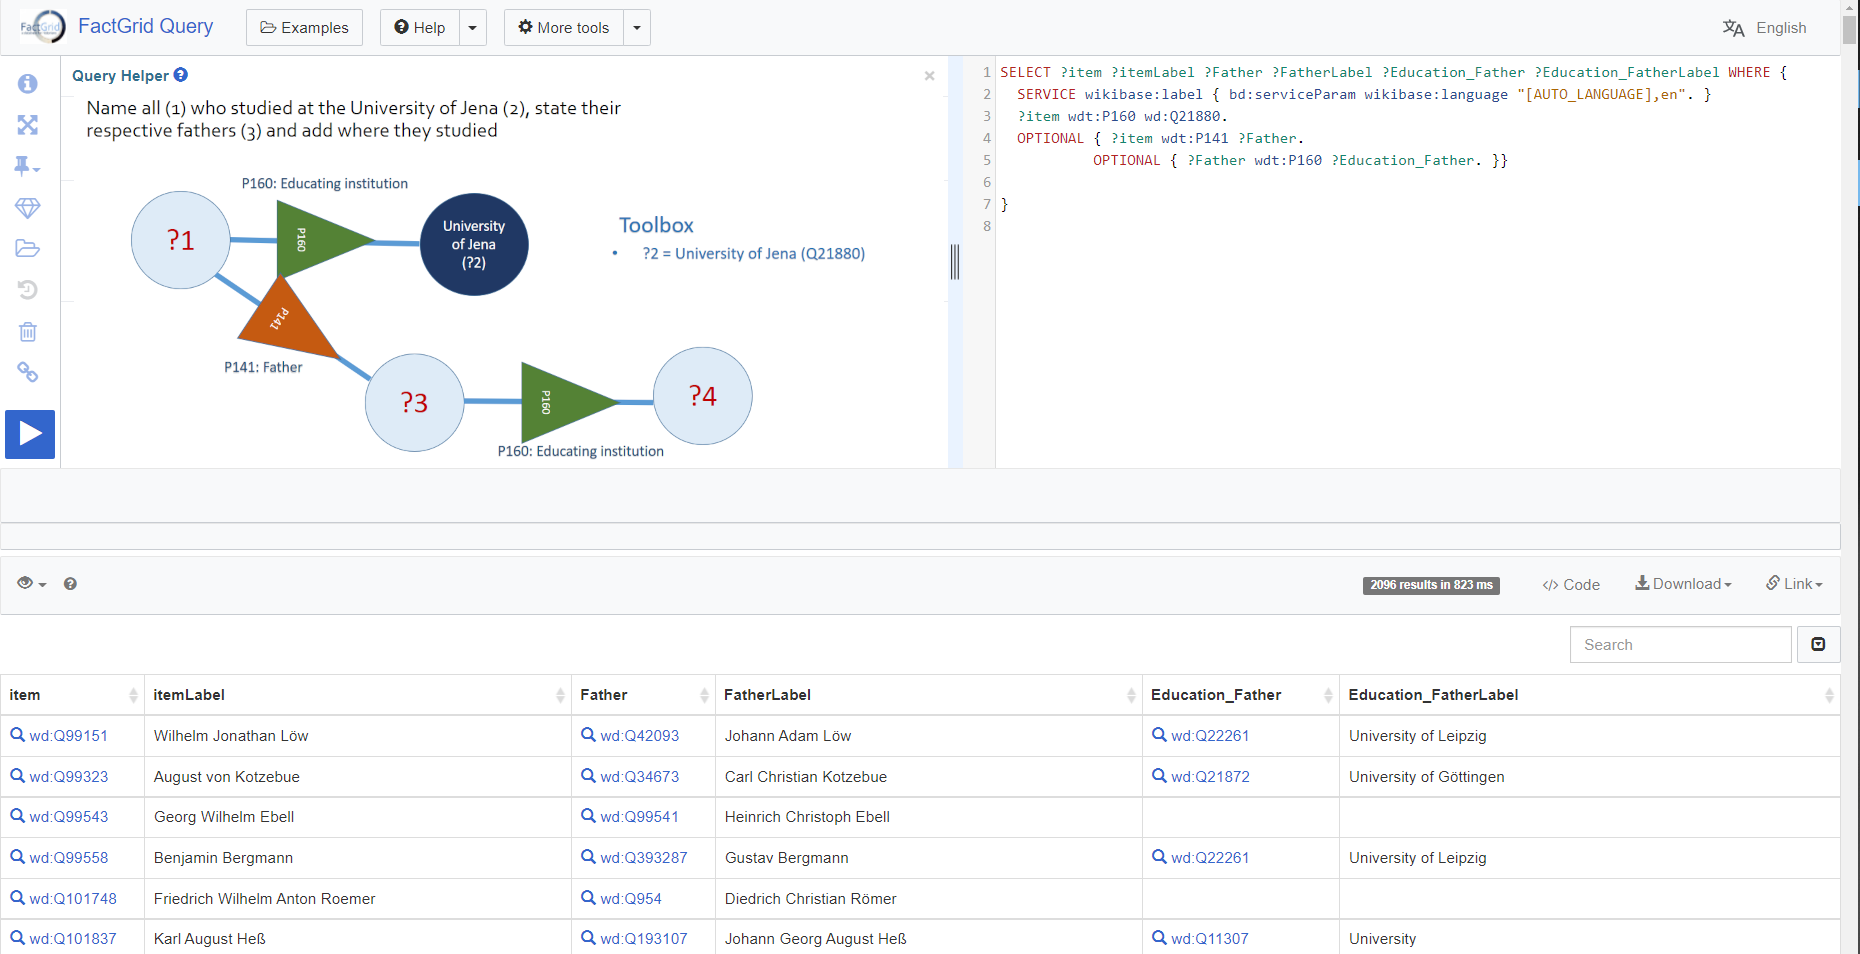
You can now ask for more information about these students as far as they are found on their Items, such as the dates of birth and death with both places in separate columns, and the names of their fathers and mothers. This is a search that uses the Query Helper:


And this is where the present Query Helper will leave you. The coordinate locations of the places of birth are on their respective Items (not on the student Items which you have been exploring so far). You need these coordinates to get a map representation, but the Query Helper does not show you how to extend your search into the related objects, nor does it show you how to bring qualifiers into your list (like the matriculation begin and end dates stated with many of the P160 links). It is also difficult to switch to reverse questions. You already know the person and now you want to know more about him, while you are still asked to use a filter…

One should have a graphic – a visual – query editor on a graph database

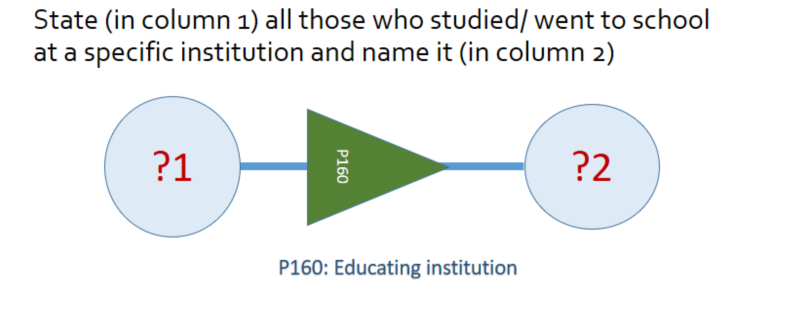
This is what the open question looks like: Who studied where? I put numbers in the circles to designate table columns.

If you are only interested in Jena University students, you should be able to specify that right on the university’s Item. Click into its sphere and type “University of Jena” into the circle:

You can now expand the query as you wish with clicks into the objects or the arrows, for example by asking for the “fathers” (P141) of these sutudents, who will appear in column 3 (this script):

And it will now be easy to get more information from the fathers – like which schools and universities did the fathers attend, again P160 (script link)?

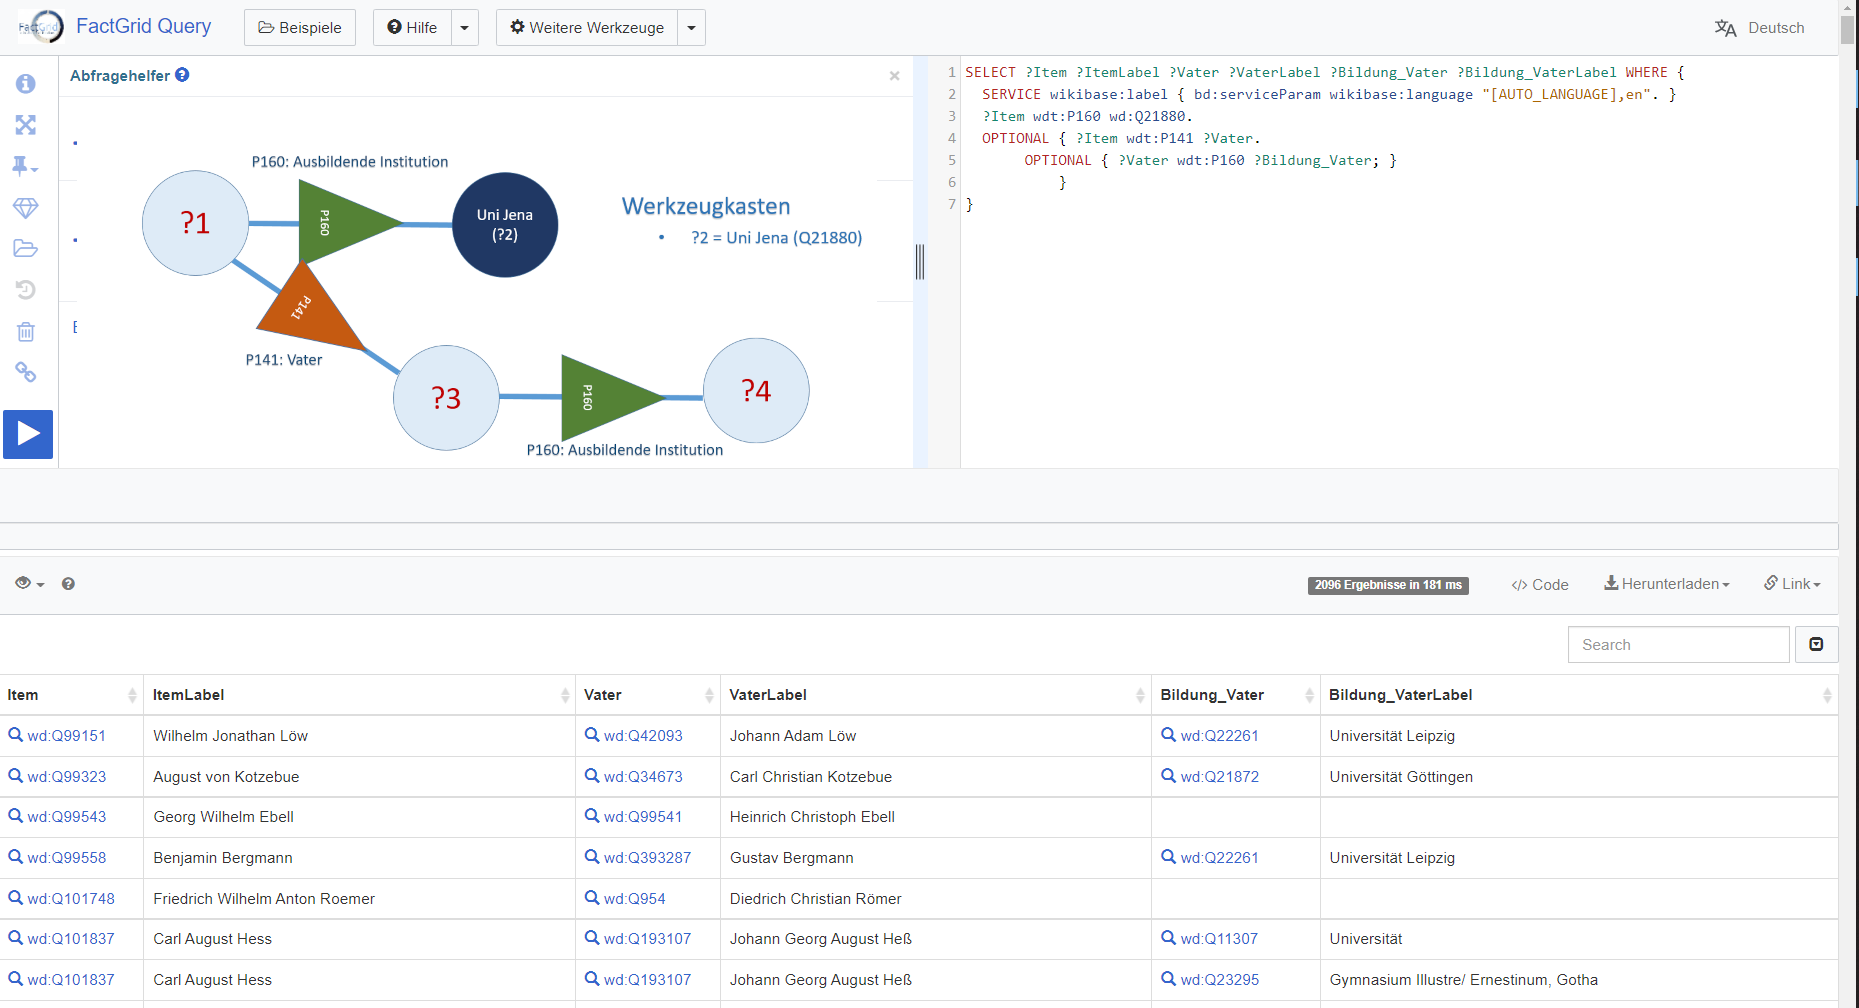
One could also formulate the short-circuit question to get all the students who studied in Jena just as their fathers had done before:

I gave the arrows in different colours because they are the components that make all the difference in objects. You want to spot identical questions and similar objects in your searches.

Optional / Mandatory

Perhaps a simple exclamation mark on the Property arrows would be enough to mark statements that shall work as filters.

Qualifiers

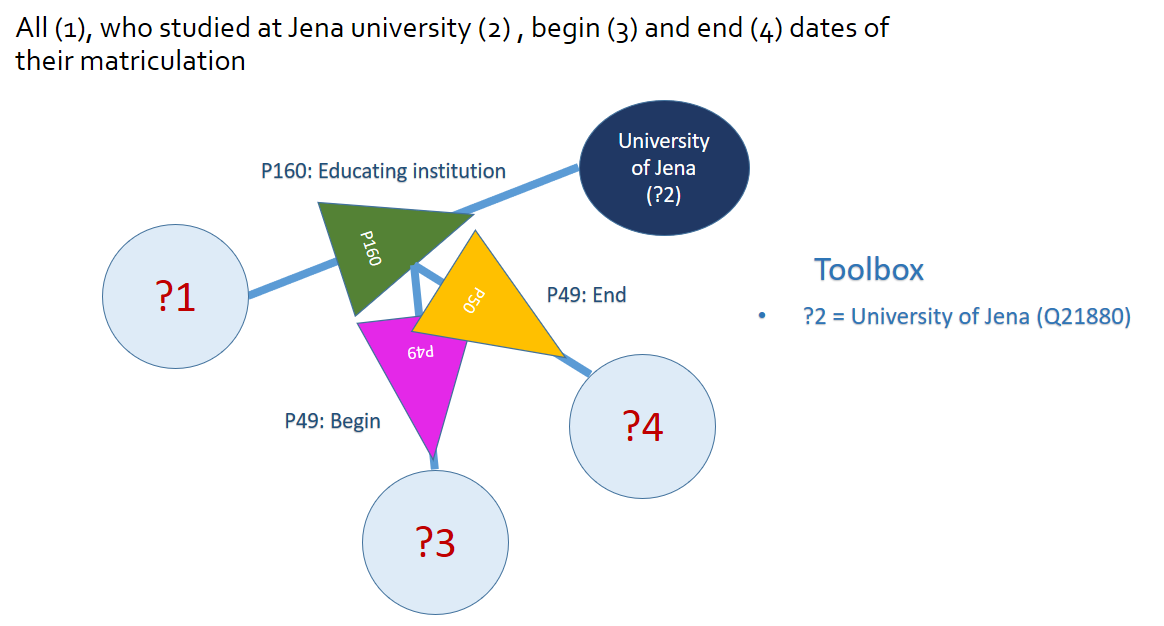
Qualifying statements are a bright Wikibase invention. Any primary triple can become the object of specific, qualifying statements. That is basically the relative clause we need in such a language (for instance if we have a person who studied at four universities and we want to say from when to when on each case). If we want to keep the graphic repertoire lean, we could simply link the qualifying statements to the Properties – for example, to get two separate columns for the begin and end dates of a specific university matriculation:

Opening the toolbox

The toolbox had been open in these various searches. I used it so far to state where a specific Item had a specific value attached to it. We would use this toolbox for all the more complex visualisations. Imagine you want to get the religious backgrounds of all known Illuminati in a bubble chart. Ask for the Items that have a P91 membership statement connected to the Illuminati, Q10677. Then ask for their religious backgrounds. If you want a bubble chart you need a count of hits on each religion and denomination:

The toolbox should also be the place to create time frames. You could here specify ranges on data you have requested.

Just a thought…

A Postscript on how to use the right and left mouse buttons in the query builder

Visual scripting might be actually quite easy. With the left mouse button you create your first circle. It will come with a question mark in it.

Click into this circle with the left mouse button, and you can put a value into this circle, a label; it will replace the question mark.

Use your right hand mouse button to get a visual context menu from his point. It will come in the form of grey options to select. Two arrows are leading away from your Item, two are leading towards it. Each time you get an open offer with question marks to replace (or to leave there) and two specific arrows that will give you ideas of what is happening here:

With the left mouse button you can select the direction into which you want to move, the selected arrow and circle will switch to colour, the other three arrows will disappear. You are now free to continue with a click into the next Item or Property of your interest. Just as in the current Query Helper, you will always get a preview of 20 table rows, that will give you an idea of the results you are about to get on your search.


Seen only later…

In einer Graphdatenbank müsste man eigentlich auch graphisch suchen können

[Link for English translation]

Das FactGrid ist eine Graphdatenbank. Das heißt, dass man sich die Datenlage in einer solchen Ressource besser nicht in Form von fünf oder zehn großen, aufeinander verweisenden Tabellen (zu Personen, Orten, Organisationen und Dokumenten etwa) vorstellt.

Das Wissen besteht in einer solchen Datenbank aus Wissensgegenständen – in Wikibase-Instanzen heißen sie „Items“ – und den Beziehungen zwischen ihnen, den „Properties“, sprich Eigenschaften, die diese Gegenstände an andere (oder auch an historische Daten, Links, Bild-Dateien oder Geokoordinaten binden).

Eine solche räumlich vernetzte Beziehung zwischen zwei Gegenständen kann man mit jedem Molekülbaukasten basteln. Hier ein Objekt mit Beziehungen zu zwei anderen. Das kann eine Person (die rote Kugel) sein mit Verbindung zu ihren Eltern (den beiden blauen Kugeln). Strukturell sieht das Gefüge aber nicht anders aus, wenn zu einer Person deren zwei Kindern erfasst sind, oder zwei Universitäten, an denen sie studierte.

Das Molekülmodell trägt nicht besonders gut. In einer Datenbank wie dem FactGrid sind alle Objekte vollkommen gleichartig. Sie alle sind monotone „Items“, die unter Q-Nummern hochgezählt werden. Erst die Aussagen zu ihnen bringen Unterschiede ins Spiel. Ein Vater ist jemand im FactGrid, wenn auf ihn von wo anders eine P141 „Vater“-Property verweist, auf „Mütter“ verweisen dagegen P142-Verbindungen.

In einer Tripel basierten Datenbank (die alles Wissen in dreigliedrige Aussagen zergliedert) genügen zwei Sorten von Bausteinen, etwa Kugeln für die Wissensgegenstände und, weil hier eben Bezugsrichtungen wichtig werden, Pfeile für die Verbindungen zwischen ihnen.

Alle Personen, die an der Universität Jena studierten, findet man, wenn man danach fragt, von welchen Items aus eine Aussage zur „ausbildenden Institution“ (P160) – auf das Item der „Universität Jena“ (Q21880) verweist. So (ausführbares Link) sieht die SPARQL-Suchanfrage aus, und die kann nun niemand so einfach „skripten“:

SELECT ?item ?itemLabel WHERE {
   SERVICE wikibase:label { bd:serviceParam wikibase:language “[AUTO_LANGUAGE],en”. }
   ?item wdt:P160 wd:Q21880.}

Wieso dies alles genau so zu schreiben ist, kann man ohne Handbuch nicht wissen, und man kann ohne Kenntnis der Datenbank auch nicht wissen, welche Q-Nummer man für die Jenaer Universität und welche P-Nummer man für die Aussage „hat hier studiert“ braucht.

Der Wikimedia Abfragehelfer (ist da bereits ein massiver Gewinn. Wenn einem klar ist, was man erreichen kann, wenn man zuerst „filtert“ und dann bestimmt, was einen an einzelnen Aussagen zu den herausgefilterten Objekten interessiert, kommt man mit dem Abfragehelfer erheblich viel weiter. In das Filterfeld kann man etwa „Uni Jena“ eingeben, ohne die Q-Nummer zu kennen. Der Autocomplete lenkt einen beim Eintippen komfortabel. Der Abfragehelfer ahnt bereits, dass einem interessiert, wer hier studierte – das ist die Property, die am häufigsten auf die Uni Jena verweist, sie kommt als erster Property-Vorschlag.

Wenn man nun mehr zu den herausgefilterten Studenten wissen will, kann man von deren jeweiligen Items Aussagen beziehen – etwa die Geburtsdaten, die Geburtsorte, die Sterbedaten und Sterbeorte, Väter und Mütter:
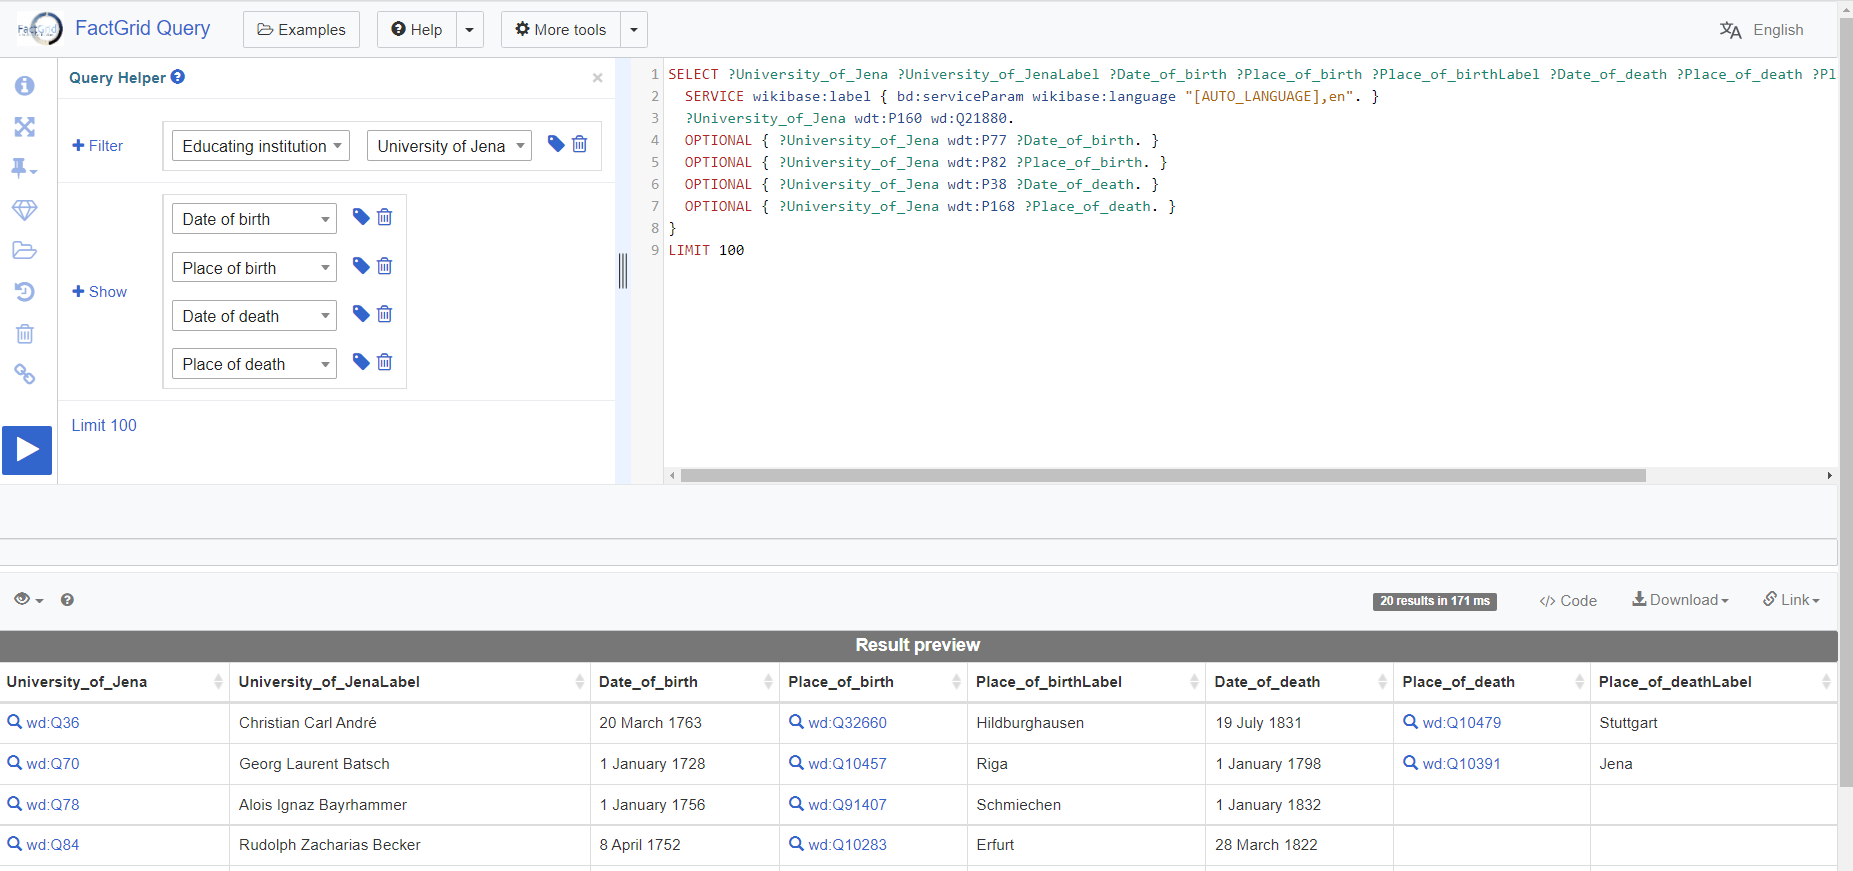
Es ist dies aber auch schon der Punkt, an der Abfragehelfer die Waffen streckt. Wenn man wissen will, wo die Orte liegen (um sie auf eine Landkarte zu spiegeln), muss man durch die Orte hindurch fragen, denn auf deren Items liegen die Geokoordinaten und hier hilft einem der Abfragehelfer nicht mehr weiter.

Es ist ebenso wenig möglich, im Abfragehelfer einen Qualifier hinzuzusetzen, um etwa den Studienbeginn mit abzufragen. Auch die einfache Umkehr der Fragen ist nicht vorgesehen: Ich kenne eine bestimmte Person und will wissen, wo sie von wann bis wann studierte.

Eigentlich sollte zur Graphdatenbank ein Visual Editor gehören…

Man müsste Graphdatenbank mit Skizzen der Beziehungen zwischen den Objekten befragen können. Hier die banalste Frage nach Allen, die überhaupt irgendeine Ausbildungseinrichtung besuchten. Wer waren sie, und welche Einrichtungen waren das?

Wenn uns nur Studenten der Uni Jena interessieren, sollten wir das für die zweite Kugel notieren können. Man tippt in den Kreis oder stellt es mit dem Werkzeugkasten klar: der zweite Gegenstand in diesem Spiel soll die Uni Jena sein:
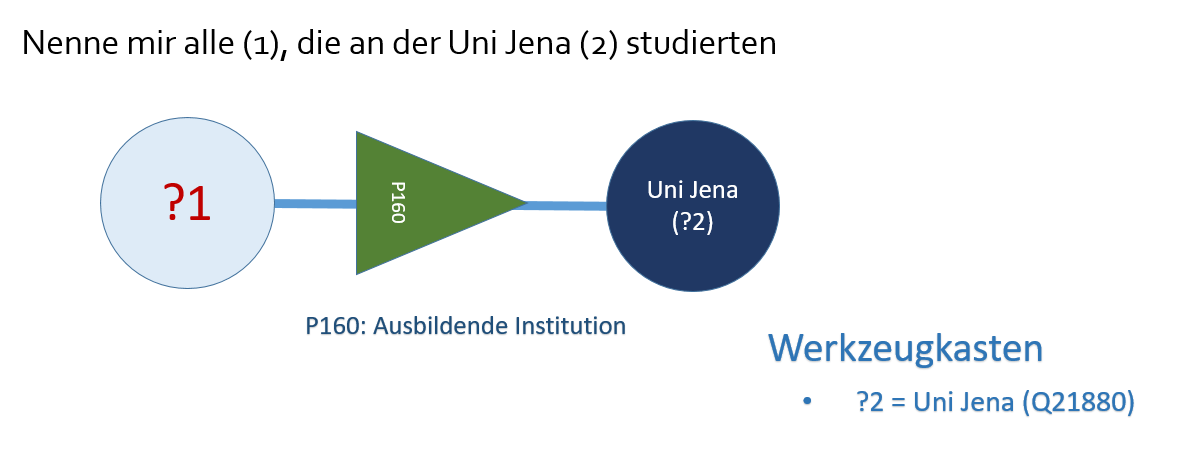
Man kann jede solche Anfrage nun beliebig erweitern etwa, indem man von den Studenten aus die Frage nach deren Vätern (P141) stellt, sie sollen hier in Tabellenspalte 3 gelistet werden:

Und man könnte nun sehr einfach den Schritt tun, der mit dem aktuellen Abfragehelfer so leicht nicht mehr zu machen ist: die nächste Frage an die Väter ansetzen. Von welchen (wieder P160) Institutionen wurden diese Väter eigentlich ausgebildet?

Man könnte die Frage auch kurzschließen, um zu erfassen, welche Studenten genau wie ihre Väter in Jena studierten:

Ich gab den Dreiecken verschiedene Farben, um sichtbar zu machen, wenn im Gefüge dieselben Fragen an verschiedenen Stellen gestellt werden (und damit strukturell ähnliche Gegenstände anspielen).

Optional / Verpflichtend

Vielleicht würde man in den Property-Dreiecken mit einem Ausrufezeichen notieren, wenn eine Aussage nicht optional, sondern verpflichtend für alle Funde gelten soll.

Qualifier

Qualifier müssten in der Visualisierung gar nicht viel komplexer sein. Hier wird jeweils ein einzelnes Statement zum Gegenstand neuer Statements. Wenn wir das graphische Repertoire schlank halten wollen, könnten wir die hinzukommenden Aussagen einfach an die vermittelnde Property binden – etwa, um bei den Studenten in zwei eigenen Spalten zu notieren, was die Qualifier P49 und P50 zu deren jeweiligem Studienbeginn und -Ende an dieser Uni notieren:

Filter und gezielte Darstellungen

Ich ließ in den letzten Suchen bereits den aufgeklappten Werkzeugkasten mitlaufen. Der nun sehr viel schlanker Befunde weiterverarbeiten. Eine Suche könnte etwa bei den Mitgliedern (P91) des Illuminatenordens (Q10677) erfassen, welchen religiösen Hintergründen (P172) sie entstammten. Bei einer Statistik, etwa einer Bubble Chart, würden wir die Zahl der einzelnen Treffer wissen wollen:

Denkbar nicht minder, dass man bei Zeitangaben Zeitfenster notieren kann, Werte die größer oder kleiner als angegeben sein müssen, um Befunde ins zeitspezifische Bild zu bringen. Spätestens bei solchen Suchen wird allen, die da schon einmal mit SPARQL hantierten und Aussagen verschachtelten klarer, dass der visuelle Query Editor sehr viel intuitiver und auch sehr viel viel schlanker erfassen würde, was einen bei einer Suche interessiert. Man würde damit spielen können, sich an Befunde herantasten können. Man würde es lernen, in den Datenstrukturen zu denken.

Mal so zum Nachdenken…

PS. Rechte und linke Maustaste – wie man im Visual Editor arbeitet

Wie würde man im Visual Editor seine Suchanfragen schreiben? Vielleicht ganz einfach: Mit der linken Maustaste setzt man einen Kreis mit Fragezeichen darinnen.

Klicke ich mit der linken Maustaste in diesen Kreis, kann ich dort etwas hineinschreiben und das Fragezeichen durch Text ersetzen.

Klicke ich mit der rechten Maustaste in den Kreis, scheinen grau vier Erweiterungsoptionen auf: Zwei Pfeile gehen von meinem Kreis weg, zwei Pfeile führen zu ihm hin. Jedes Mal gibt es zwei offene Angebote mit lediglich einem Fragezeichen darin, und zwei Angebote (zur Erklärung, was hier geschieht), bei denen Muster-Text gegeben ist:
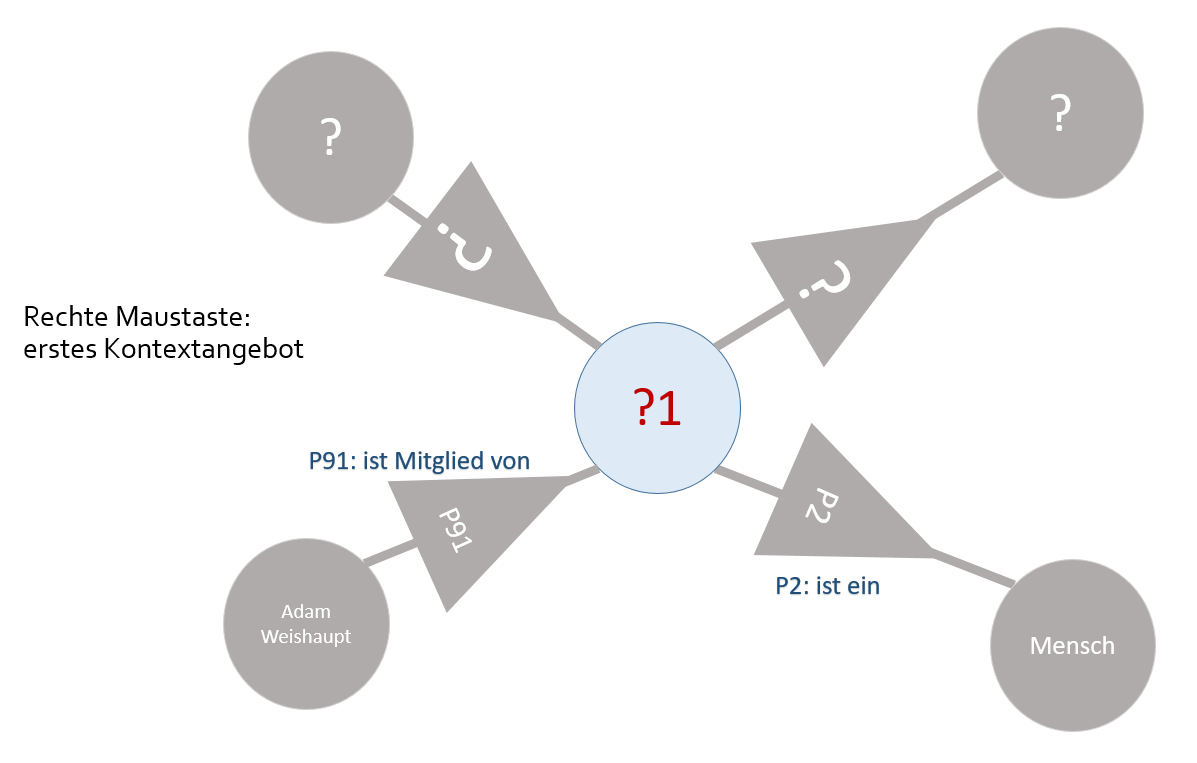
Mit der linken Maustaste kann ich die Richtung meiner Wahl anklicken, diese erscheint jetzt farbig, die anderen drei bislang grauen Pfeile werden damit unsichtbar. Ich kann nun fortfahren und Fragezeichen (von Properties oder Items) durch Text ersetzen, oder auf einen Pfeil oder Kreis klicken und mir mögliche Erweiterungen von hier aus anzeigen lassen.

Wie im aktuellen Abfragehelfer erhalte ich immer eine Vorschau von 20 Zeilen Tabelle, mit der ich sehe, was ich hier soeben getan habe.
Filling a Wikibase instance with millions of data

As more and more Wikibase instances are cropping up we are seeing attempts to start them with masses of data from already existing data bases that want to switch to the new software.

Experimenting I tried to find a faster way to insert a huge amount of items into a Wikibase instance. I have not been able to insert more than two or three statements per second using the ‘official’ tools, such as QuickStatements or the WDI library.

Therefore, I am inserting the data directly into the MySQL database used by Wikibase.

The process consists of these steps:

  • generate the data for an item in JSON
  • determine the next Q number and update the JSON item data accordingly
  • insert data into the various database tables

However, if you do this without a transaction it is still terrible slow. In my setup only 120 items per minute. However, if I wrap the inserts into a transaction I was able to insert 33,000 items/minute.

Steps to run the experiment

  mysql:
    image: mariadb:10.3
    restart: unless-stopped
    ports:
      - "3306:3306"
    volumes:
  • Start the containers: docker-compose up and wait until you see lines ending like:
[main] INFO  o.w.q.r.t.change.RecentChangesPoller - Got no real changes
[main] INFO  org.wikidata.query.rdf.tool.Updater - Sleeping for 10 secs

For me it took a minute to insert 100 items without a transaction and 25 seconds to insert 10,000 items with a transaction.


first published at https://github.com/jze/wikibase-insert/

The Illuminati Correspondence Fast Forward

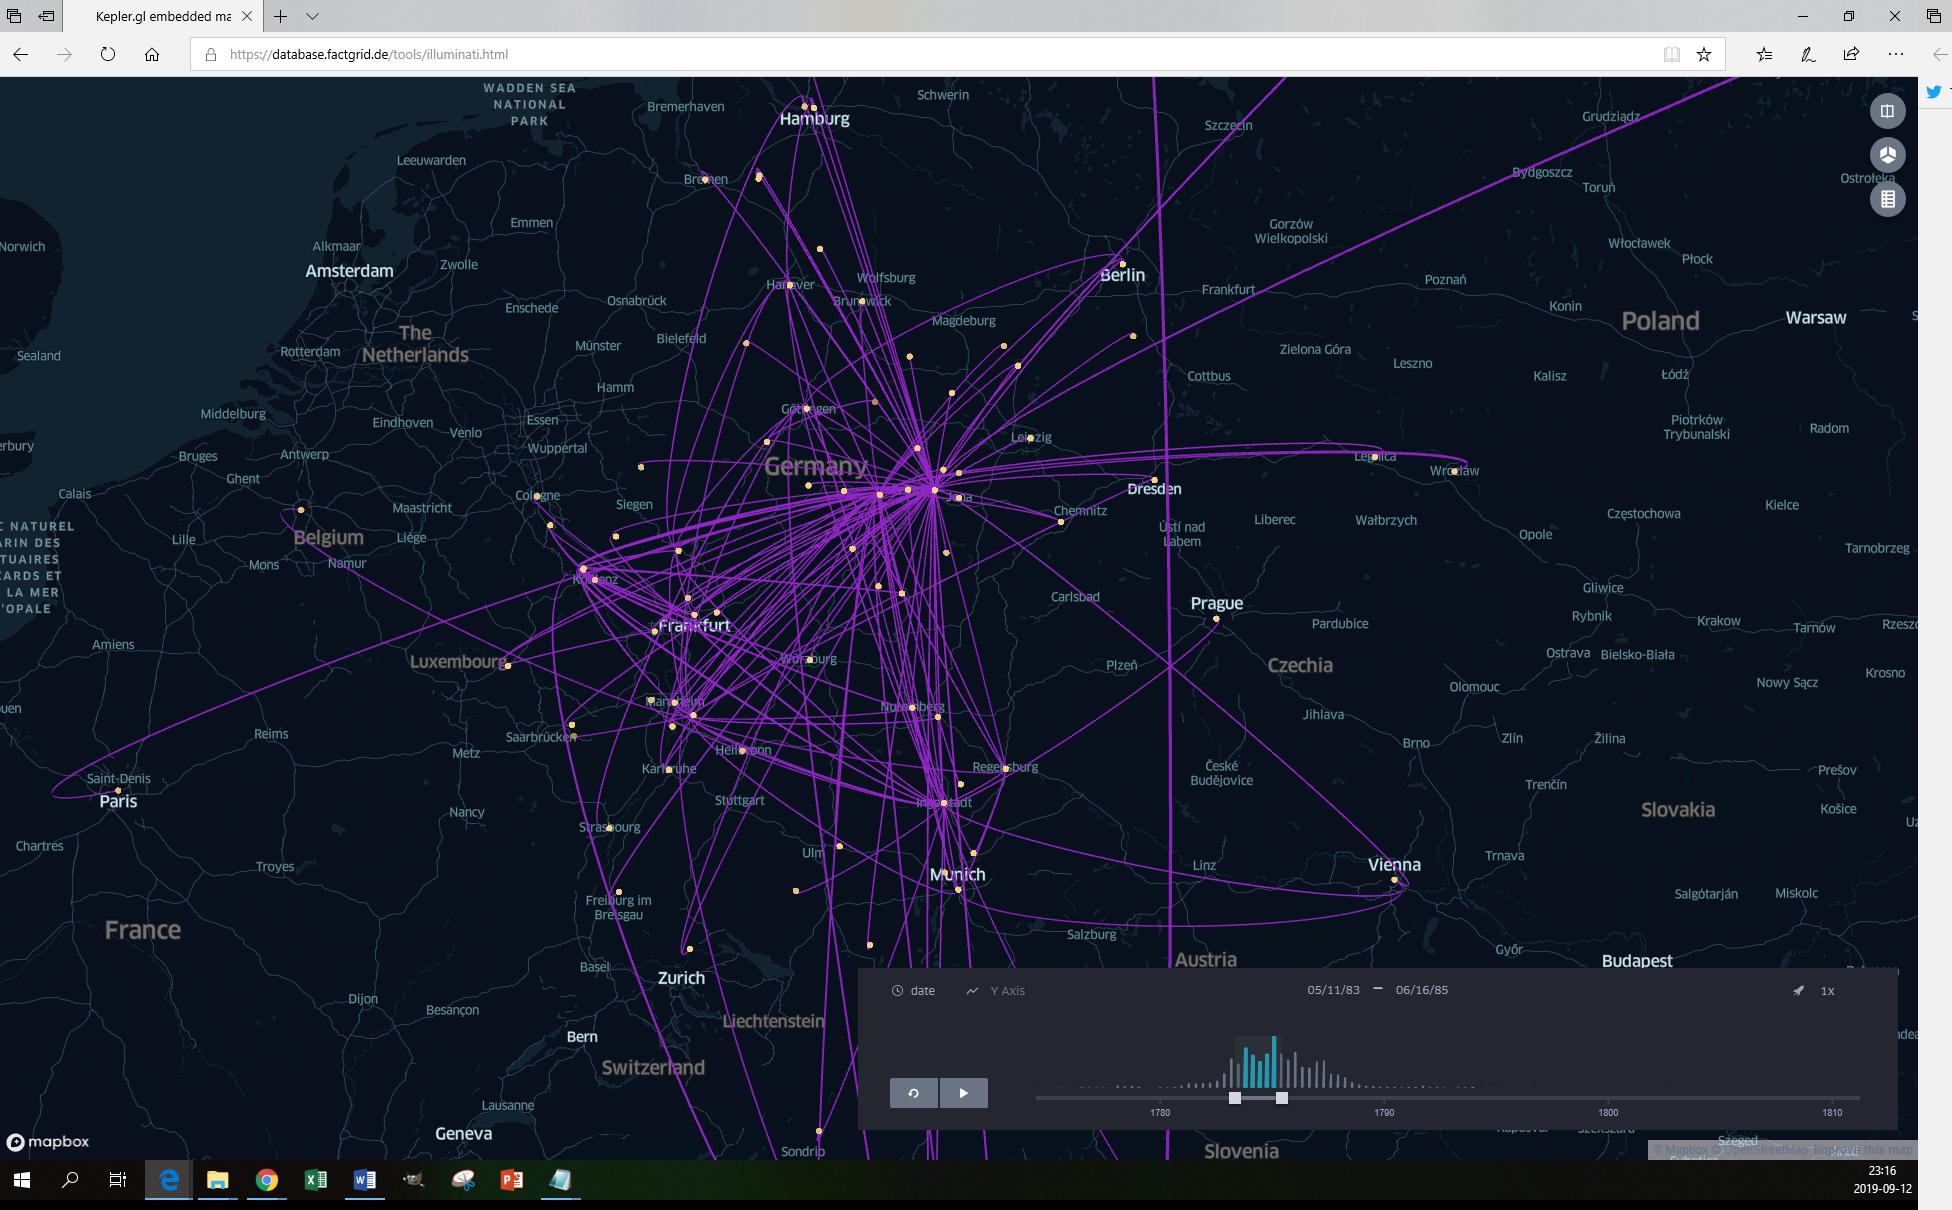
Paul-Olivier Dehaye scripted this visualisation for us (using Uber’s http://Kepler.gl). An html-file that captures all the Illuminati exchanges from the 1770s into the 1790s as far as we have spotted them (there are some misfits in this visualisation which we can now suddenly identify and which need to be eliminated on the database; the visualisation itself is basically a screenshot, it does not adapt to changes in the database).


<click to play>

The idea to represent letters in lines on a map together with a timeline on which the user can set a span that can then be shifted through the timeline – has become a classic in recent years: The Stanford Republic of Letters project seems to have been the first to come up with this visualisation ten years ago

Nodegoat is offering this visualisation as a standard aplication.

The visualisation is cool for correspondences since letters happen to travel on maps from senders to recipients (or to multiple recipients as soon as letters are forwarded – a standard procedure in all hierarchical Illuminati exchanges).

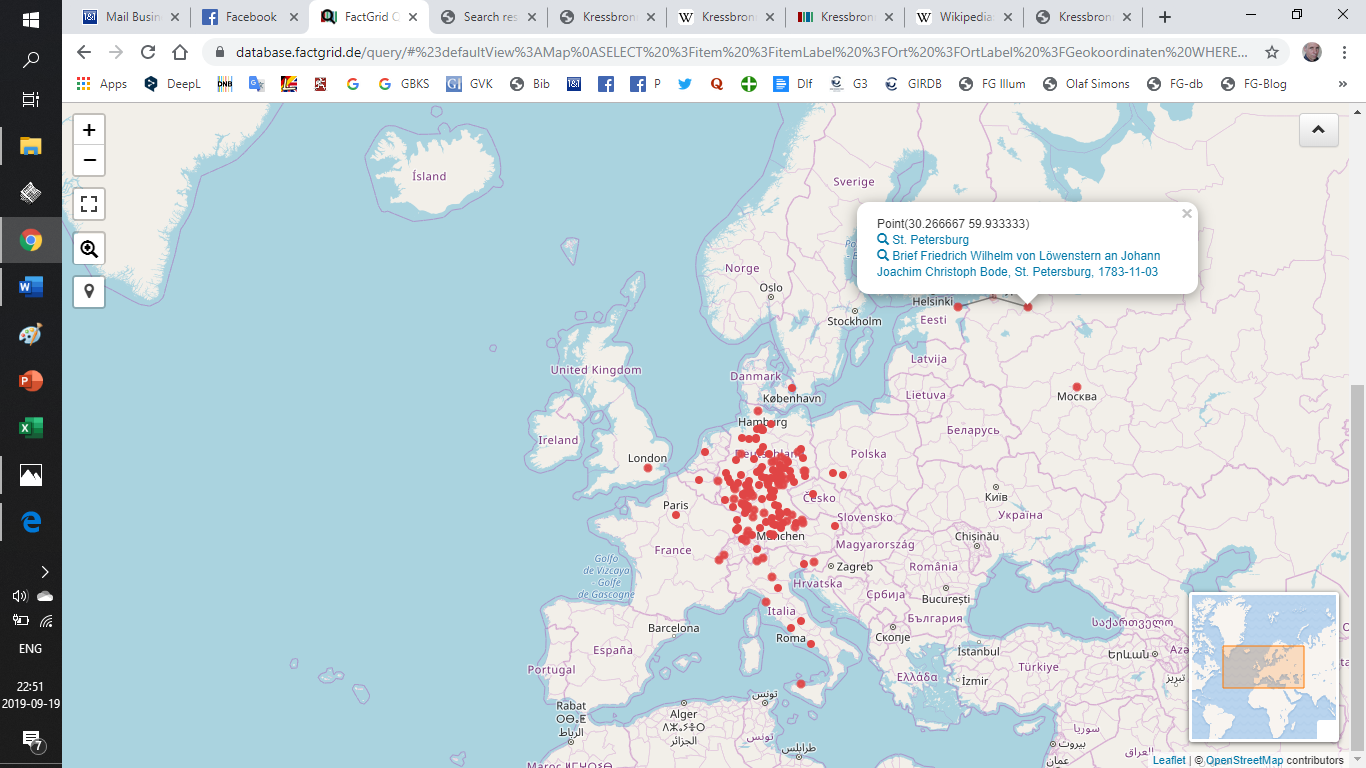
The simple visualisation which the SPARQL query service had yielded was already interesting to look at:

Illuminati Letters – sent from where?

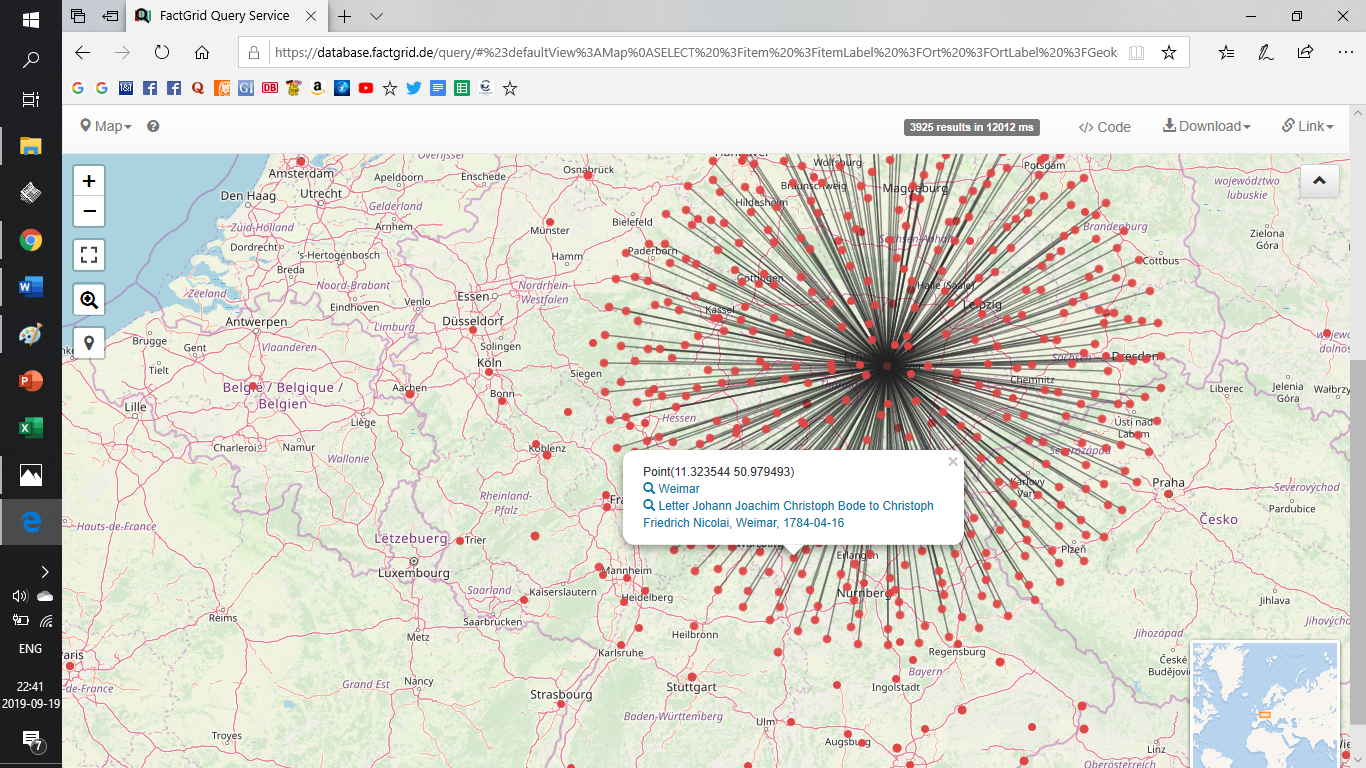
It showed the sender’s places of all known Illuminati letters and vaguely hinted at the Illuminati centres in Germany. But the picture remained static. It lacked the directions and the historical drama. You got more information if you clicked at an individual dot – usually this would open just a speech bubble with information about the particular letter that created this dot. But here and there one would see far more: a dot sparkling a fireworks of dots as in the case of Weimar (from where Christoph Bode organised the Order as the de facto leader after 1785/86). The beautiful bouquet is otherwise misleading – the dots do reach out to the various destinations; they stand for quantities which you only see if you hit the right dot (and which then obliterate much of the rest of the picture).

Bode’s Weimar correspondence – a nice representation of the number of documents but not much more.

Letters – that is the charm of the more refined temporospatial visualisation – tend to come in correspondences and these evolve, they stretch out, they blossom, and they die eventually.

The Illuminati are an almost ideal object for this particular visualisation as they present a full case to study. The “Republic of Letters” had remained out of reach for the Stanford project. The thing which we today prefer to call “academia” or “scientific community” was far bigger than the carefully selected and spectacular cases that created the first visualisations in 2009 — and only the whole picture would have revealed the evolution of our present academic debates between the 1480s and 1800. Regions and emerging nations brought forth increasingly scattered cultures of learning and they invented modern national topics such as our present debate of (usually national) literature. The spectacular exchanges could not possibly reveal these developments.

The Illuminati correspondence is, admittedly, no longer complete. We are looking here basically at the archives of Weishaupt and Bode and the Bavarian publications of 1787 – but it is even in this selection a clearly and well defined object. You know when you have an Illuminati letter in front of you: The author uses code names and the (messy) Illuminati-Persian calendar. The Organisation created complete genres of letters such as the monthly “Quibus Licet” which every member had to hand in and which would be answered with a “Reproche” signed by “Basilius” two months later. The genres are as remarkable as the internal affairs discussed in these letters.

The Order itself was at the same moment basically a complex correspondence: an organisational construct that generated a particular and unstable flow of information. Paul’s time lapse encapsulates the history and the drama of the Illuminati: For about two years – from 1776 to 1778 – we see very little: Ingolstadt is the place where Weishaupt’s “Perfectibilists” could organise most of their affairs in face to face meetings.

The situation changed dramatically in 1778: The Illuminati opened a lodge in Munich and started to infiltrate the masonic world.

Again two years later, in 1780, we see Adolph Freiherr von Knigge rising with exchanges he is now maintaining from Frankfurt and then from Heidelberg.

Knigge wins Bode for the Order in September 1782 and Bode in turn resolves the escalating conflict between Knigge and Weishaupt in 1784 and 1785: Knigge is forced to withdraw but Weishaupt does not regain his former position as the head of the organisation. Bavaria exposes the Order in 1786/87 with the first two editions of intercepted Illuminati documents. Weishaupt flees to Regensburg and then to Gotha where he ends in personal ignominy while it remains Bode’s part to come to the conclusion that he would not reform the secret organisation which could no longer claim to be a secret society.

You can pinpoint the individual letter to see who was writing here to whom with what letter exactly

Paul’s abstract movie wants to be explored. You can define the time frame and push it manually through the timeline, and you can click at each line to see whose letter is creating it. We can now see the overall quantities and the processes, the organisation’s actual growth and collapse on the map.

Far from perfect

The visualisation is state of the art and yet not much more than a show case at the moment. It is neither created in ever fresh queries nor can you use the html-page without some coding for your own questions.

The message, however is clear: The interface one would love to have with this visualisation could be far more simple than the present SPARQL query service. One would design it to always explore “correspondences” (P122Q11243) and one would ask the user for simple P—Q specifications of his or her desired visualistion. In the Illuminati case this would be:

  • Research Interest (P97) — Illuminati (Q10677)

One might just as well ask for “author” and name a couple of authors, or for recipients, but the Interface would do the rest and run the SPARQL query of correspondences to generate a list of the letters in question with senders’ and receivers’ places and dates.

Paul’s message is that this can be done: The centre of his html file is basically a SPARQL-search from our database. Maybe someone will script the interface during the Wikidata.con next month in Berlin.

And one would love to have more…

  • Think of a visualisation that tracked the movements of people on maps and that captured the moments when people (could have) met.
  • Think of a visualisation of the dissemination of objects – like copies of a specific edition.
  • Think of the spread of an organisation like Freemasonry with its mother lodges and filial branches.
  • Imagine a visualisation that traced your ancestors with a look at genealogical data.

Wikibase instances should invite the production of interfaces that can do certain jobs without bothering the user with SPARQL or Java proficiency. The cool thing about Wikidata or FactGrid is that these instances develop their (more or less) static ways to organise core data. We get more data but we continue to make the same useful statements especially if we have visualisations asking for these statements to be made with certain P- and Q-numbers.

Nodegoat would not lose any its charm if we began to offer similar visualisations; it will remain the software for the vast majority of projects that prefer the exclusive environment on which they can run exclusive and definitive presentations of their data. Wikibase instances are already very different beasts: They invite projects that want an open and growing landscape of data, and these projects will show the far bigger need of standard visualisations (i.e. of visualisations that use existing data and existing data structures). Projects on FactGrid or Wikdata need interfaces that already speak SPARQL. Time then to look at the more complex visualisations that are already running in environments such as the Stanford Republic of Letters Project or the Cultures of Knowledge Project in Oxford. We should act as the coolest competitors in this field, gather inspiration with the aim to inspire in turn.

2018-11-16/17: Wikibase/Illuminatenorden Data-Mining Workshop: 10 Reisestipendien nach Gotha zu vergeben

[Google translation of this page]

Das Forschungszentrum Gotha veranstaltet jährlich einen „Illuminatenworkshop“ mit dem Ziel, aktuelle Forschung zum Geheimorden der 1770er und 1780er Jahre zu bündeln.

Nachdem wir dieses Jahr in einer Kooperation mit Wikimedia Deutschland gut 5.000 komplexere Sätze von Metadaten zu den Akten des Illuminatenordens in einer Wikibase-Instanz verfügbar machten, möchten wir mit diesem Aufruf Wikidata-Enthusiasten einladen, gemeinsam mit Forschenden einen ersten Blick in diesen Datenschatz hinein zu wagen.

  1. Welche Visualisierungen (Netzwerke, Timelines, geographischen Erfassungen…) lassen sich aus dem Datenmaterial ziehen?
  2. Wie müsste man die Daten strukturieren, um noch ganz andere Forschungsfragen anzugehen?
  3. Wie lässt sich das dieses Datenmaterial am besten mit Volltext-Transkripten von Dokumenten verknüpfen?
  4. Wie kann unser bisheriges konventionelles Wiki – die Gotha Illuminati-Research Base – aus der Datenbank Information beziehen?
  5. Wie modellieren wir Datenobjekte auf einem Kurs, der Informations-Redundanzen vermeidet?
  6. Wie würde man Daten eingeben, um Zeitschnitte (und Repräsentationen auf alten Landkarten) zu bewerkstelligen?
  7. Wie gelingt es uns, unsere Reasonator-Integration klug in Richtung eines mehrsprachigen, Übersichtlichkeit generierenden Informationsangebots zu nutzen?
  8. Wie machen wir unsere Arbeit optimal im Wikidata-Universum nutzbar?

Unser diesjähriger Workshop soll Datenanalyse und Forschung zusammenbringen. Mitspieler, die sich mit SPARQL Datenbankabfragen und Visualisierungen auskennen, wollen wir einladen, mit der Forschung ins Gespräch zu kommen. Wir haben die Daten, die Datenbank und detailliertes Wissen über die die Aktenlage des Illuminatenordens mit seinen gut 1350 Mitgliedern und Tausenden von internen Dokumenten, um das Data-Mining spannend machen –, aber erfassen im Moment kaum, welche Aufschlüsse uns unser eigenes Material in der ganz neuen technischen Erschließung gibt. Wir verfügen über Erfahrung mit unserem bisherigen Arbeitsinstrument, einem konventionellen Wiki, aber erfassen im Moment gerade in Ansätzen, was uns das komplexere Medium der Wikidata-Technologie an hinzukommenden Optionen der praktischen Arbeit liefert.

Wer am wissenschaftlichen Programm im ganzen Umfang teilnehmen will, kann am Freitag den 16. November 2018 ab 9:00 am Forschungszentrum Gotha in unsere Forschungsdiskussionen Einblick nehmen.

Der Data-Mining-Workshop, dem die vorliegende Einladung speziell gilt, wird am Nachmittag Forschende und Wikidata-Kenner zusammenbringen. Die Veranstaltungen werden im Verlauf des Nachmittags getrennt in einen Wikibase Bastel-Workshop und in die Serie der spezifischeren Fachreferate.

Ein gemeinsames Abendessen ist für 19:00 angesetzt. Das Forschungszentrum steht Bastelwütigen indes danach noch die ganze Nacht offen.

Am zweiten Workshop-Tag wollen wir gegen 11:00 die Gruppen wieder zusammenführen, um voneinander zu lernen:

  • Was können Forschende aus der Datenbank gewinnen?
  • Was wünschten sich Datenbankenthusiasten an Forschungsarbeit, um im Data-Mining wesentlich tiefer einsteigen zu können?
  • Wie würde man ein größeres Aktenerschließungsprojekt mit dieser Datenbank am besten organisieren?

Wir können Reisekosten (unter der sich entwickelnden Etatlage sicher aus dem deutschsprachigen Raum), Unterbringung und Tagegelder übernehmen. Teilnahmewünsche sind mit eingehenderen Aussagen zu Arbeitsinteressen bis zum 5. November 2018 zu richten an olaf.simons@piere-marteau.com.


Erste Suchen und Visualisierungen zur Anregung

Sample queries: https://database.factgrid.de/wiki/Sample_queries

SPARQL — the Query Language

Wikibase installations are – at this moment – best explored with the SPARQL query language. Specialists are able to write queries in SPARQL but this is not what you would do as a beginner. Most people take a look at an example of a query and then modify the example to suit heir needs.

Here just briefly for the beginning a couple of useful links.


Above: SPARQL in 11 minutes. Note: this video is not specifically on using the Wikibase software.

Above: Navino Evans, co-founder of Histropedia (http://www.histropedia.com/), demonstrating how to construct Wikidata Sparql Queries.

Useful First Aid Links

How to use QuickStatements to get data into the FactGrid

The video shows how easy it is to get data from regular spreadsheets via QuickStatements into the database.

You will find a handy cheat sheet of spreadsheet commands, to format your data here: https://docs.google.com/spreadsheets/d/1ov0BL_ob2rFhIl24G4BQhnVAdWeUYOAzlRphEgzOtAE/edit?usp=sharing

Our instance, https://database.factgrid.de/ hosted at the University of Erfurt has its own QuickStatements tool to manage the import of data: Access the tool under https://database.factgrid.de/quickstatements/.

If you do not have an account contact olaf.simons@pierre-marteau.com to get one.