Browsing FactGrid with the FactGrid Viewer

update: 25-05-2024

FactGrid is a wonderful, free and collaborative resource that the Gotha Research Center of the University of Erfurt in Germany has made available to the international historical community through the efforts of Olaf Simons. Many potential users are unfortunately put off by its apparent complexity. It is true that an initiation is necessary to exploit all its possibilities. In the future, new tools should make it much easier to use. In the meantime, it is possible to use a certain number of tools that already exist on the platform. Here I will introduce the FactGrid Viewer tool.

A first use of FactGrid is simply to search and browse the database. This is accessible to everyone, without the need to log in. However, the user interface (technically that of Wikidata, the platform for which Wikibase was produced) is not very engaging. In fact, it looks more like an input mask than a user interface. This is why I developed the Viewer, which allows you to browse FactGrid easily and comfortably. This post is a presentation of the tool and a user guide.

Presentation of the Viewer

The Viewer is a small Javascript application (it is written in Typescript with the help of the Angular framework, then transcompiled in Javascript) of about 1MB. This means that it runs on the user’s computer. The Viewer allows users to navigate within FactGrid by displaying data as structured pages in the language of their choice. To open the application, use this blog’s menu above (where it says FactGrid Browsers), use the left-hand sidebar under the Browse category of the wikibase platform or go directly to the address https://database.factgrid.de/viewer.

FactGrid viewer homepage

The Viewer home page is very simple. From top to bottom: (1) a banner with the logo of FactGrid on the left,  three icons , and   on the right; (3) the title FactGrid;  (3)  a simple search form; (4) a link “SPARQL query”; (5) on a black background, the list of Items already consulted on the computer (with the same browser) (max. 50) with, for each, an icon .

You have directly access to FactGrid by clicking on its logo and to this post by clicking on .

You can select the language in which you wish to display the data. The default language is English. To change the language, click on and select the language of your choice. Six languages are currently available: English, German, French, Spanish, Italian, Hungarian. Once the language is selected, the change is instantly implemented in the browser and all labels, aliases and descriptions are displayed in that language; if text is missing in the selected language, the Viewer will display the text in the default language, i.e. English, or, if the English text is also missing, in French or in German.

It is also possible to select a  research area of special interest to you. By default, the search is performed on all Items in FactGrid. To limit the search to a specific theme, click on and select the theme of your choice. This feature is still in development. You can see demontration examples for Paris and  the bibliography of Harmonia Universalis.

The search is done with the form (where the Ex. Goethe indication is). As you type in characters, the Viewer almost instantaneously explores the 1 million Items in FactGrid and returns those whose labels (including their aliases) begin with the characters you typed. The number of Items returned cannot exceed 50. The labels and descriptions are displayed in the selected language. To view the data for an Item, simply click on its icon .

Layout of a page

The Viewer pages are the heart of the Viewer. They enable all the data relating to the Items contained in FactGrid (label, description, aliases, statements) to be displayed in the selected language.

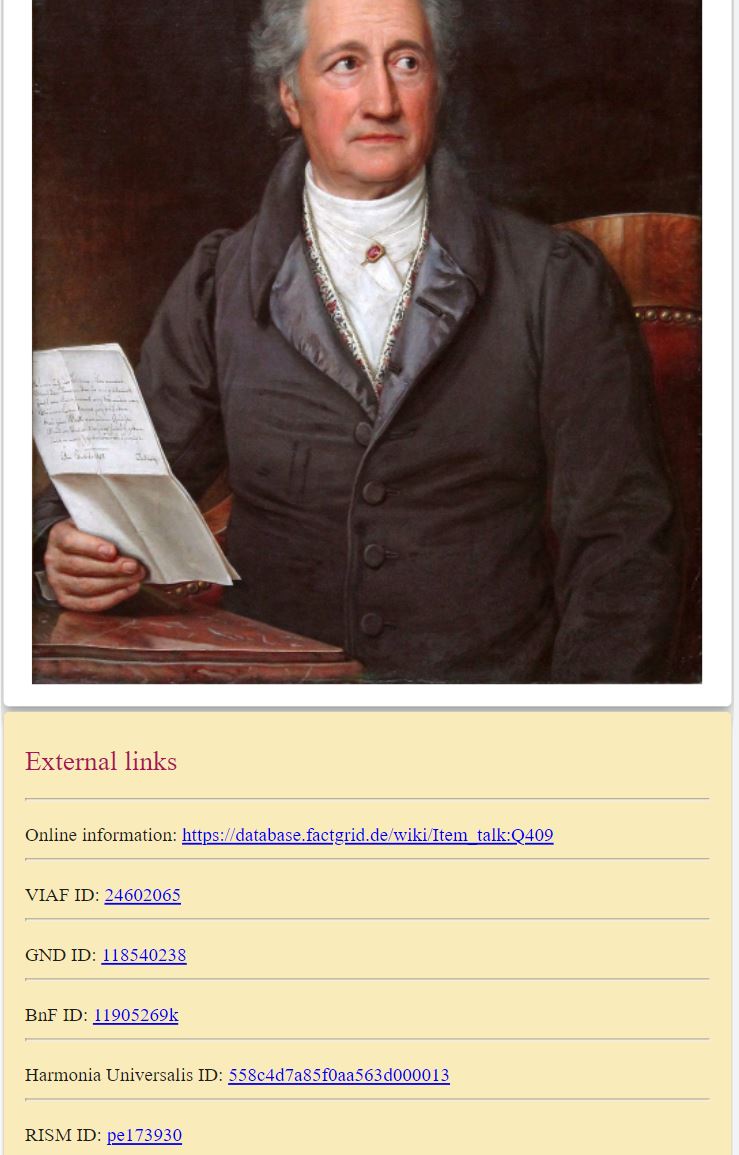
The Viewer organises the pages to make the data more readable and consistent. The layout is adapted to the size of the screen (responsive display), so that FactGrid can be consulted comfortably on a mobile phone as well as on a large screen. See the example of the page of Johann Wofgang von Goethe.

A page on the Viewer consists of one horizontal strips and five blocks.

The strip

Above the strip a “new search” link takes you back to the home page. On the  strip, a “linked pages” link with a chevron leads to the left-hand removable panel.

The header block and the statement block

The two main blocks (see the case of Ahaha), on a white background, are :

(1) The header block. It includes the label of the Item in large type, followed by all its aliases and description, its Q-ID (clickable to go to the Item FactGrid page) and a series of general statements. The first of these statements indicates the “Instance of” for the Item (for example: Human(s)). This statement is mandatory. If it is missing, the Viewer displays a warning message. Other optional statements may follow, like “Subclasses of”, “FactGrid research area”, “Research projects that contributed to this data set”, etc. The labels are displayed without description.

(2) The statement block. This block contains all the statements related to the Item, except for the general statements in the header and the external links. A statement must consist of a property and an object (which can itself be a FactGrid Item). The statement block can be divided into thematic sub-blocks, the theme of which is indicated by a title in red (e.g. “Education”, “Career and activities”, “Sociability and culture”, etc.).

Statements grouped by property

The statements in a block are grouped by property. In a group the property label is displayed in bold blue (e.g. “Educative institution”) and the object labels are displayed below in black with an indentation, each on one line, followed in general by their description in grey (except in the general thematic block where the descriptions, almost always obvious, have been considered unnecessary). An icon may be used to go to the corresponding page.

A statement may include additional information. Firstly, there are qualifiers (e.g. a date or a place). These are displayed with an indentation after the main information on the object in smaller characters (the name of the qualifier, i.e. the label of the corresponding property, is in blue italics, the label of the object is in black roman and the description in grey). Then there are the references (e.g. the mention of a source) with an indentation, also in small print (the name of the reference, i.e. the label of the corresponding property, is in red italics, its object is in black roman and the description in grey). The statements of the same group are automatically ordered chronologically when date qualifiers exist.
The image block and the link block

The five other blocks are :

(1) The image block where illustrations relating to the Item may be displayed. This block is at the top right on a computer screen and just below the title of the page on a mobile phone screen.

(2) The link block, with a yellow background, where external links and Wiki links (e.g. links to Wikidata or Wikipedia pages) are displayed. This block is on the right on a computer screen (below the image block when it exists) and below the main blocks on a mobile phone screen.

(3) The block of pages already consulted on the computer (with the same browser) (max. 50), on a black background, with an icon for each one (this block is also present on the home page). This block is on the right below the link block on a computer screen and below the statement block on a mobile phone screen.

(4) The info block on the bottom of the statement block, accessible by clicking the icon on the blue strip, contains useful information on the Q-Item: the tree of classes to which it belongs as an instance and, in case the Q-Item is itself a class, the tree of its superclassses and a list of its instances (limit = 200).

(5) The block on the left-hand side panel, accessible by clicking on “linked pages”, contains a list of all the pages which are linked to the displayed Item, i.e. for which there is a statement (main statement or qualifier) whose object is the displayed Item. An icon allows you to go to the Item page. By clicking on “main page”, you come back to the item page.

Other features

In addition, the Viewer gives access to many additional pieces of information obtained by SPARQL queries, for instance:
– in the page of a family name, the list of the people in FactGrid bearing this name; ex: Müller.
– in the page of an institution (for instance a learned society), the list of the people in FactGrid who are members of this institution; ex: the mesmerist Society of Harmony in Paris.
– in the page of an address, the list of the people in FactGrid living at this address; ex: Square d’Orléans, no. 9 in Paris, where the composer Frédéric Chopin lived from 1842 to 1849.
– in the page of an occupation, the list of the people in FacGrid having this occupation: see, for instance, the cas of  landscape painter.

Landscape painters in FactGrid

and many others…

When there are more than 15 items in the list, a search form can be used to filter items by label and description. The filtered items can be downloaded by clicking on the icon .

the Viewer displays on OpenStreetMap the location corresponding to the geographical coordinates declared for an Item (for example a city like Paris or an address, like the real estate at Johannisgasse 15 .

an old address in Leipzig

The Viewer also displays the locations corresponding to the geographical coordinates declared for a set of Items obtained by a SPARQL query.

Paris, rue de la Paix

For example, on the page of the Rue de la Paix in Paris, there are two maps: a map with the location of the street and a map with all the house numbers of this street in early Nineteenth century. The second map is the product of a SPARQL query.

The FactGrid viewer also includes a SPARQL query service in the Viewer with a model. It must be used in the same way as the FactGrid query service, keeping the two bottom lines (introduced by BIND) in order to generate for each returned item a ?viewer link to the Viewer.

The Viewer can be improved. Feel free to comment. Any suggestions are welcome at bbelhoste@gmail.com.

See the GitHub repository.
Imagine a Graph Query Helper for Graph Databases

[Link für Deutsche Übersetzung]

FactGrid is a graph database. If you run searches in such a database you should rather not think of a resource filled with interrelated tables (of people, places, organizations, documents…) – but of something more spatial, more geometric, more graphic.

Think of your own knowledge. You will not be able to give a table of all the names that have a meaning in your knowledge, or of all the places related to these names. Our knowledge is more like a web of interrelated objects. Nicolaus Copernicus? He is the man who wrote De revolutionibus. What else do you know? Maybe that he was born in Thorn, Polish Toruń, and that he studied at the Universities of Padua and Bolognia. I at least do not immediately know much more about the author who brought about the “Copernican Revolution”. That, of course, is an object that rings many more bells, with all the connections to other items of knowledge it has in my knowledge. I can add that these two universities were good places to study those subjects that were to become the natural sciences – but that again is knowledge on these objects, not on Copernicus, knowldge that got stuck in my knowledge as it added some more colour to my knowledge about Copernicus, the person. Think of interrelated objects hanging together in the wider mesh of your knowledge – of objects that link to each other like atoms in a molecule.

…an object with links to two other objects? That could be someone linked to her two parents. The graph would not look different if that was another person with his two daughters, or Copernicus with links to the two universities mentioned. Well, Copernicus studied at four universities, to be precise – but that is not the problem.

The problem is that the molecular model does not carry particularly well as it puts all the differences into the atoms, hence the various colours in images and the different connectivities of atoms in the typical three dimensional tool kits. In a database like FactGrid all the objects are structurally completely identical. They all are just “Items”: meaningless points, “nodes”, under Q-numbers counted up from 1 to infinity. The various and very specific Properties between the objects make all the differences in a graph database: “Fathers” are in FactGrid Items that have P141 “father” properties referring to them; mothers have P142 Properties linking from other items towards them.

In a triple-based database (which breaks down all knowledge into three-part statements) we will need no more than two sorts of components: You can take spheres for the objects of our knowledge, the “Items”, and arrows for the links that run between them – arrows as we have to express directions in the various statements.

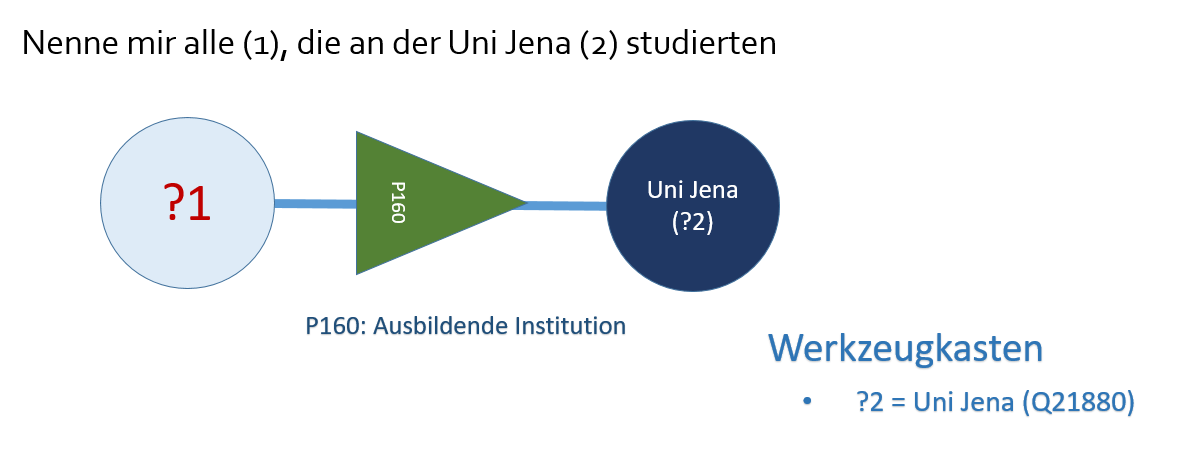
Those who studied at the University of Jena have P160 “educating institution” statements leading from their Items to the University of Jena Item Q21880. This is the SPARQL script (see this link to see what it does):

SELECT ?Item ?ItemLabel WHERE {
   SERVICE wikibase:label { bd:serviceParam wikibase:language “[AUTO_LANGUAGE],en”. }
   ?Item wdt:P160 wd:Q21880.}


SPARQL is a wonderfully versatile language to send searches through graph databases but it is impossible to script even this most simple query without handbook knowledge. What is worse: You will need additional knowledge of our database to know that Jena’s University has this the Q-number Q21880 and that students must have P160 statements on them that will link to this University with the Q21880 indetifier.

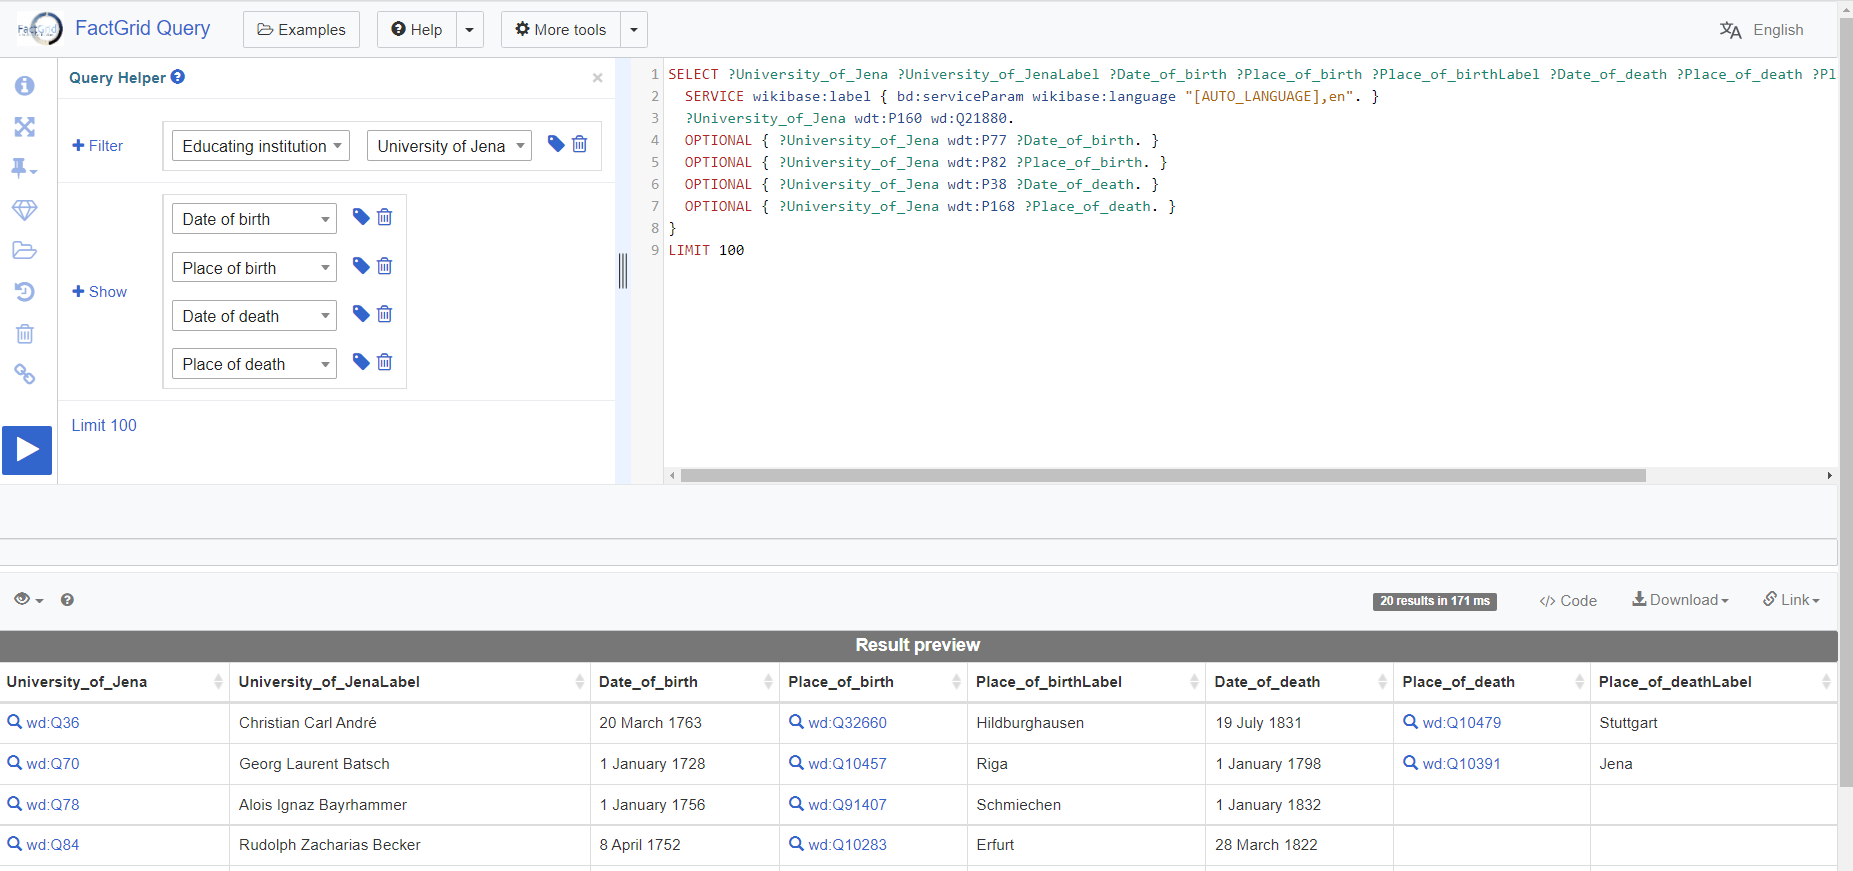
The Wikimedia Query Helper is the coolest gadget as soon as you understand what a “Filter” can do for you in your query. Once you realise that this is the input field that will need the university in your specific query you can start to type “Univ…” and the autocomplete will lead you to the Q-number you are looking for. Select the Item you are interested in and the tool will already propose the “who studied here?” Property P160 as this is the most used Property leading to Q21880. It is fair to assume you are looking for people who studied at this university.

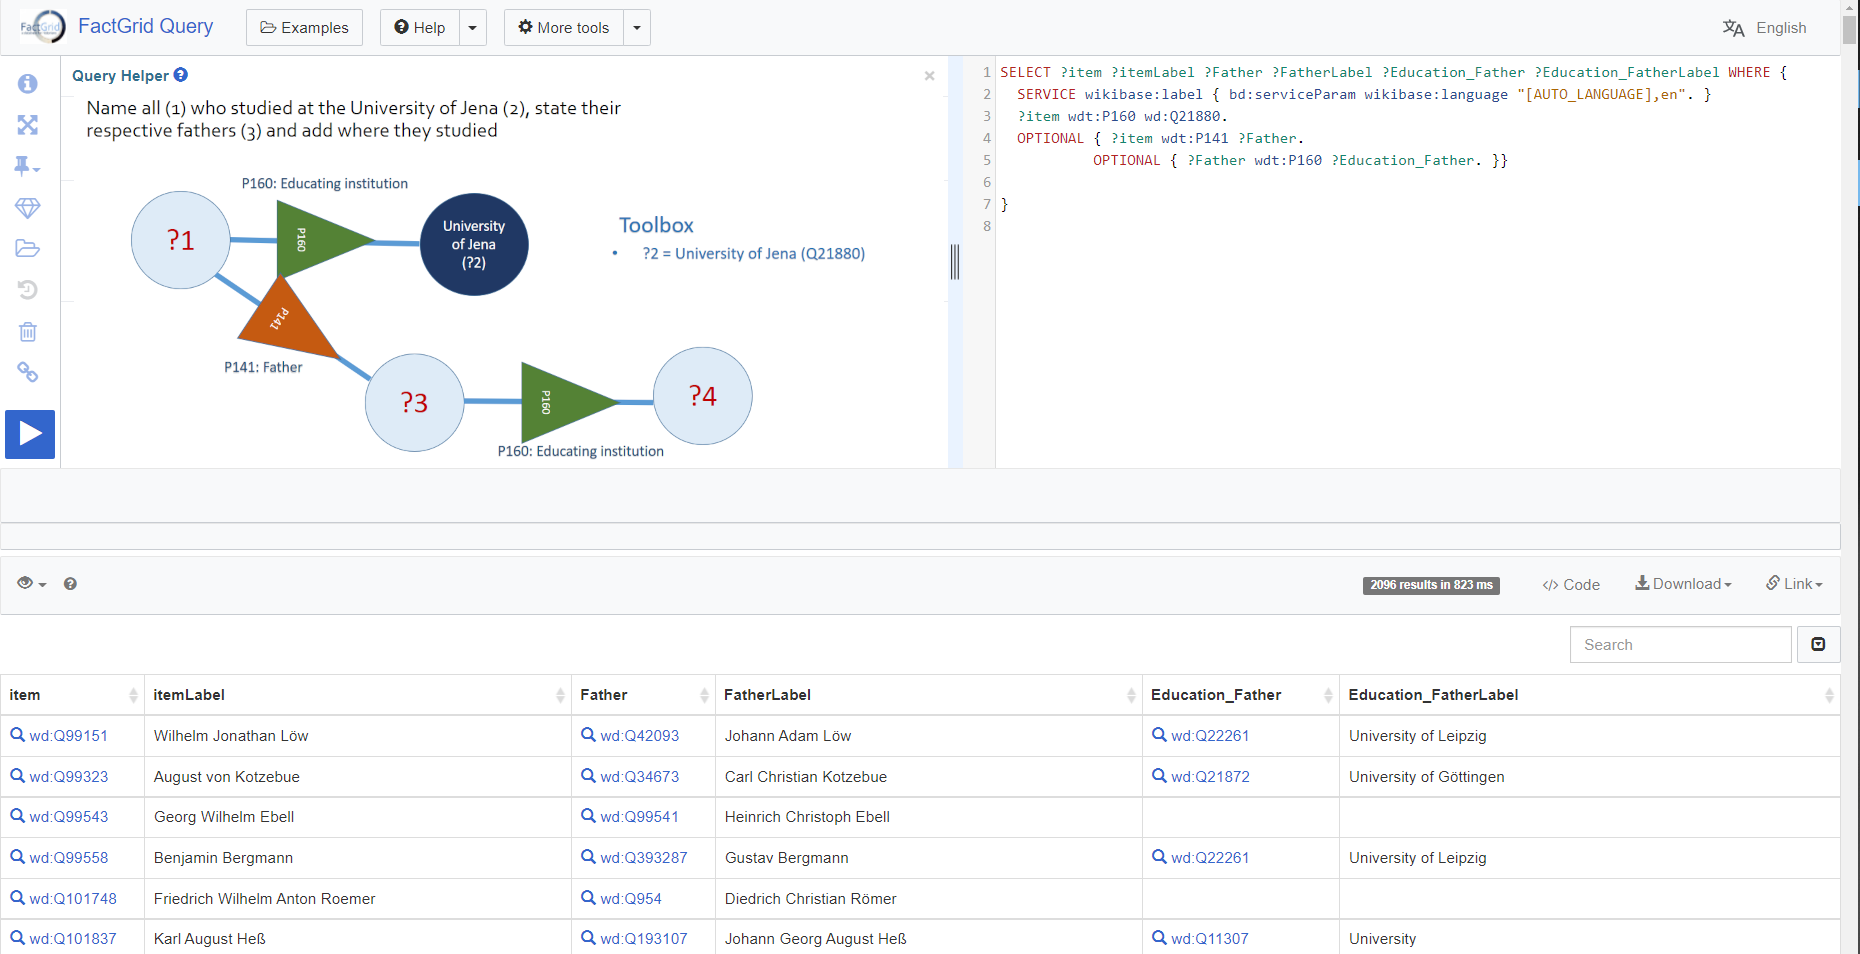
You can now ask for more information about these students as far as they are found on their Items, such as the dates of birth and death with both places in separate columns, and the names of their fathers and mothers. This is a search that uses the Query Helper:


And this is where the present Query Helper will leave you. The coordinate locations of the places of birth are on their respective Items (not on the student Items which you have been exploring so far). You need these coordinates to get a map representation, but the Query Helper does not show you how to extend your search into the related objects, nor does it show you how to bring qualifiers into your list (like the matriculation begin and end dates stated with many of the P160 links). It is also difficult to switch to reverse questions. You already know the person and now you want to know more about him, while you are still asked to use a filter…

One should have a graphic – a visual – query editor on a graph database

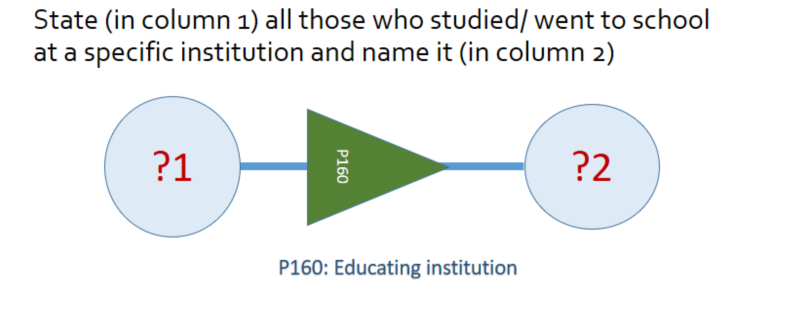
This is what the open question looks like: Who studied where? I put numbers in the circles to designate table columns.

If you are only interested in Jena University students, you should be able to specify that right on the university’s Item. Click into its sphere and type “University of Jena” into the circle:

You can now expand the query as you wish with clicks into the objects or the arrows, for example by asking for the “fathers” (P141) of these sutudents, who will appear in column 3 (this script):

And it will now be easy to get more information from the fathers – like which schools and universities did the fathers attend, again P160 (script link)?

One could also formulate the short-circuit question to get all the students who studied in Jena just as their fathers had done before:

I gave the arrows in different colours because they are the components that make all the difference in objects. You want to spot identical questions and similar objects in your searches.

Optional / Mandatory

Perhaps a simple exclamation mark on the Property arrows would be enough to mark statements that shall work as filters.

Qualifiers

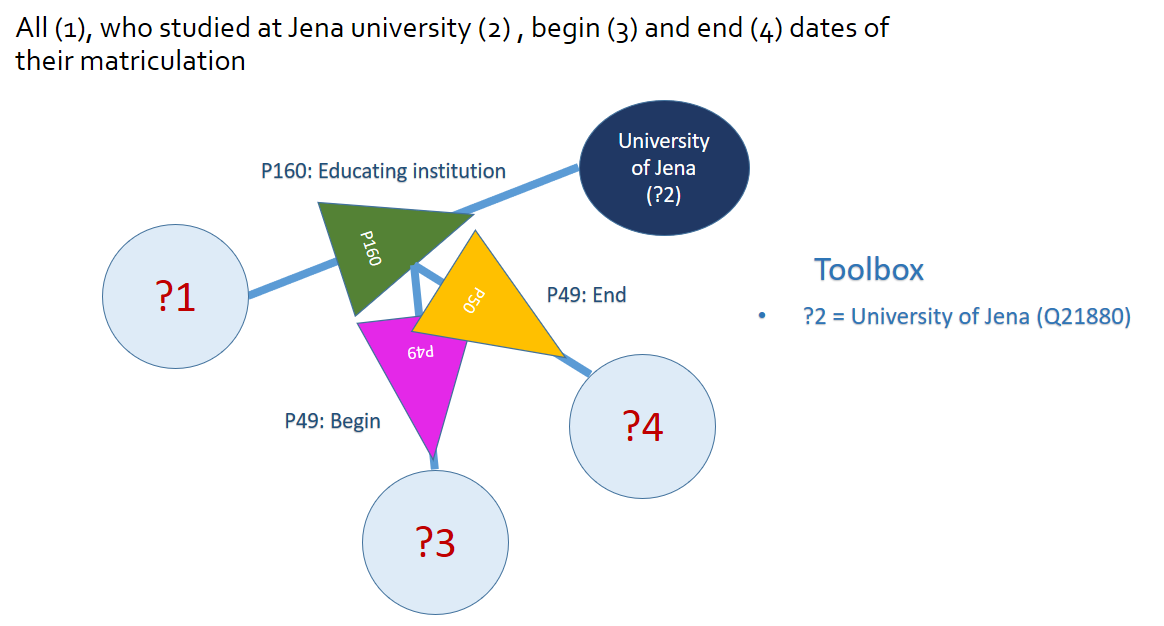
Qualifying statements are a bright Wikibase invention. Any primary triple can become the object of specific, qualifying statements. That is basically the relative clause we need in such a language (for instance if we have a person who studied at four universities and we want to say from when to when on each case). If we want to keep the graphic repertoire lean, we could simply link the qualifying statements to the Properties – for example, to get two separate columns for the begin and end dates of a specific university matriculation:

Opening the toolbox

The toolbox had been open in these various searches. I used it so far to state where a specific Item had a specific value attached to it. We would use this toolbox for all the more complex visualisations. Imagine you want to get the religious backgrounds of all known Illuminati in a bubble chart. Ask for the Items that have a P91 membership statement connected to the Illuminati, Q10677. Then ask for their religious backgrounds. If you want a bubble chart you need a count of hits on each religion and denomination:

The toolbox should also be the place to create time frames. You could here specify ranges on data you have requested.

Just a thought…

A Postscript on how to use the right and left mouse buttons in the query builder

Visual scripting might be actually quite easy. With the left mouse button you create your first circle. It will come with a question mark in it.

Click into this circle with the left mouse button, and you can put a value into this circle, a label; it will replace the question mark.

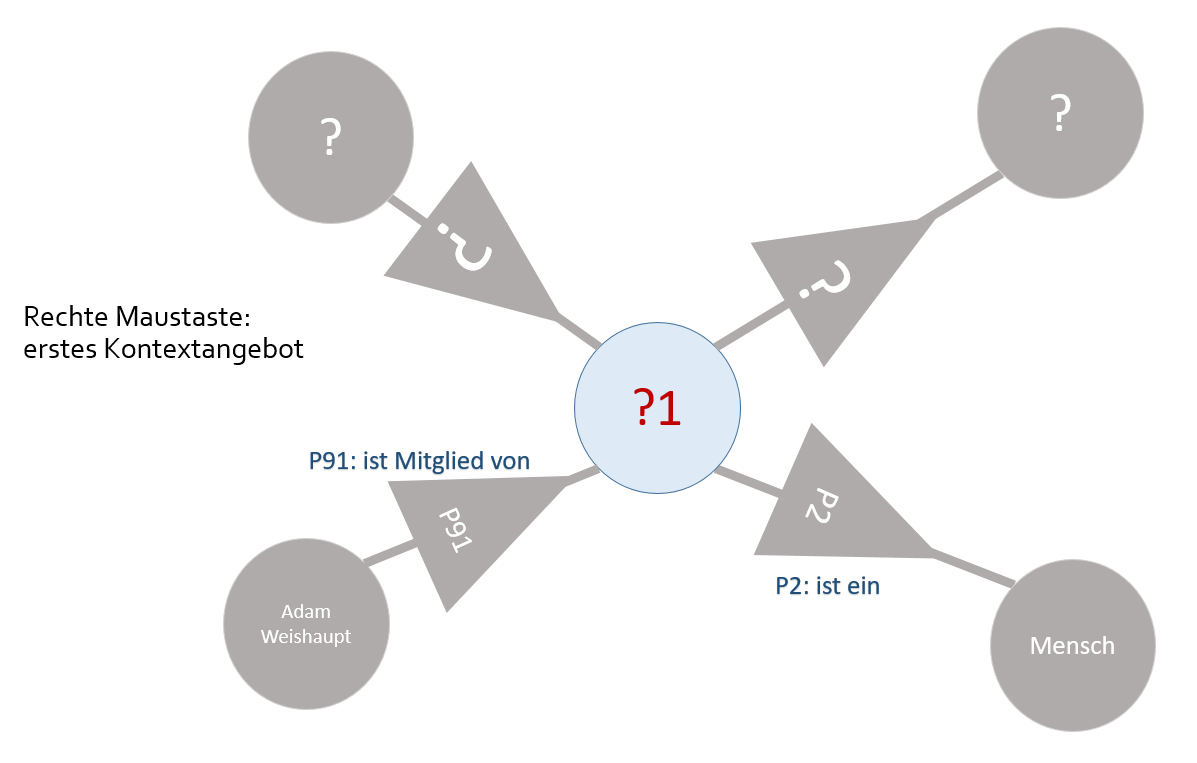
Use your right hand mouse button to get a visual context menu from his point. It will come in the form of grey options to select. Two arrows are leading away from your Item, two are leading towards it. Each time you get an open offer with question marks to replace (or to leave there) and two specific arrows that will give you ideas of what is happening here:

With the left mouse button you can select the direction into which you want to move, the selected arrow and circle will switch to colour, the other three arrows will disappear. You are now free to continue with a click into the next Item or Property of your interest. Just as in the current Query Helper, you will always get a preview of 20 table rows, that will give you an idea of the results you are about to get on your search.


Seen only later…

In einer Graphdatenbank müsste man eigentlich auch graphisch suchen können

[Link for English translation]

Das FactGrid ist eine Graphdatenbank. Das heißt, dass man sich die Datenlage in einer solchen Ressource besser nicht in Form von fünf oder zehn großen, aufeinander verweisenden Tabellen (zu Personen, Orten, Organisationen und Dokumenten etwa) vorstellt.

Das Wissen besteht in einer solchen Datenbank aus Wissensgegenständen – in Wikibase-Instanzen heißen sie „Items“ – und den Beziehungen zwischen ihnen, den „Properties“, sprich Eigenschaften, die diese Gegenstände an andere (oder auch an historische Daten, Links, Bild-Dateien oder Geokoordinaten binden).

Eine solche räumlich vernetzte Beziehung zwischen zwei Gegenständen kann man mit jedem Molekülbaukasten basteln. Hier ein Objekt mit Beziehungen zu zwei anderen. Das kann eine Person (die rote Kugel) sein mit Verbindung zu ihren Eltern (den beiden blauen Kugeln). Strukturell sieht das Gefüge aber nicht anders aus, wenn zu einer Person deren zwei Kindern erfasst sind, oder zwei Universitäten, an denen sie studierte.

Das Molekülmodell trägt nicht besonders gut. In einer Datenbank wie dem FactGrid sind alle Objekte vollkommen gleichartig. Sie alle sind monotone „Items“, die unter Q-Nummern hochgezählt werden. Erst die Aussagen zu ihnen bringen Unterschiede ins Spiel. Ein Vater ist jemand im FactGrid, wenn auf ihn von wo anders eine P141 „Vater“-Property verweist, auf „Mütter“ verweisen dagegen P142-Verbindungen.

In einer Tripel basierten Datenbank (die alles Wissen in dreigliedrige Aussagen zergliedert) genügen zwei Sorten von Bausteinen, etwa Kugeln für die Wissensgegenstände und, weil hier eben Bezugsrichtungen wichtig werden, Pfeile für die Verbindungen zwischen ihnen.

Alle Personen, die an der Universität Jena studierten, findet man, wenn man danach fragt, von welchen Items aus eine Aussage zur „ausbildenden Institution“ (P160) – auf das Item der „Universität Jena“ (Q21880) verweist. So (ausführbares Link) sieht die SPARQL-Suchanfrage aus, und die kann nun niemand so einfach „skripten“:

SELECT ?item ?itemLabel WHERE {
   SERVICE wikibase:label { bd:serviceParam wikibase:language “[AUTO_LANGUAGE],en”. }
   ?item wdt:P160 wd:Q21880.}

Wieso dies alles genau so zu schreiben ist, kann man ohne Handbuch nicht wissen, und man kann ohne Kenntnis der Datenbank auch nicht wissen, welche Q-Nummer man für die Jenaer Universität und welche P-Nummer man für die Aussage „hat hier studiert“ braucht.

Der Wikimedia Abfragehelfer (ist da bereits ein massiver Gewinn. Wenn einem klar ist, was man erreichen kann, wenn man zuerst „filtert“ und dann bestimmt, was einen an einzelnen Aussagen zu den herausgefilterten Objekten interessiert, kommt man mit dem Abfragehelfer erheblich viel weiter. In das Filterfeld kann man etwa „Uni Jena“ eingeben, ohne die Q-Nummer zu kennen. Der Autocomplete lenkt einen beim Eintippen komfortabel. Der Abfragehelfer ahnt bereits, dass einem interessiert, wer hier studierte – das ist die Property, die am häufigsten auf die Uni Jena verweist, sie kommt als erster Property-Vorschlag.

Wenn man nun mehr zu den herausgefilterten Studenten wissen will, kann man von deren jeweiligen Items Aussagen beziehen – etwa die Geburtsdaten, die Geburtsorte, die Sterbedaten und Sterbeorte, Väter und Mütter:

Es ist dies aber auch schon der Punkt, an der Abfragehelfer die Waffen streckt. Wenn man wissen will, wo die Orte liegen (um sie auf eine Landkarte zu spiegeln), muss man durch die Orte hindurch fragen, denn auf deren Items liegen die Geokoordinaten und hier hilft einem der Abfragehelfer nicht mehr weiter.

Es ist ebenso wenig möglich, im Abfragehelfer einen Qualifier hinzuzusetzen, um etwa den Studienbeginn mit abzufragen. Auch die einfache Umkehr der Fragen ist nicht vorgesehen: Ich kenne eine bestimmte Person und will wissen, wo sie von wann bis wann studierte.

Eigentlich sollte zur Graphdatenbank ein Visual Editor gehören…

Man müsste Graphdatenbank mit Skizzen der Beziehungen zwischen den Objekten befragen können. Hier die banalste Frage nach Allen, die überhaupt irgendeine Ausbildungseinrichtung besuchten. Wer waren sie, und welche Einrichtungen waren das?

Wenn uns nur Studenten der Uni Jena interessieren, sollten wir das für die zweite Kugel notieren können. Man tippt in den Kreis oder stellt es mit dem Werkzeugkasten klar: der zweite Gegenstand in diesem Spiel soll die Uni Jena sein:

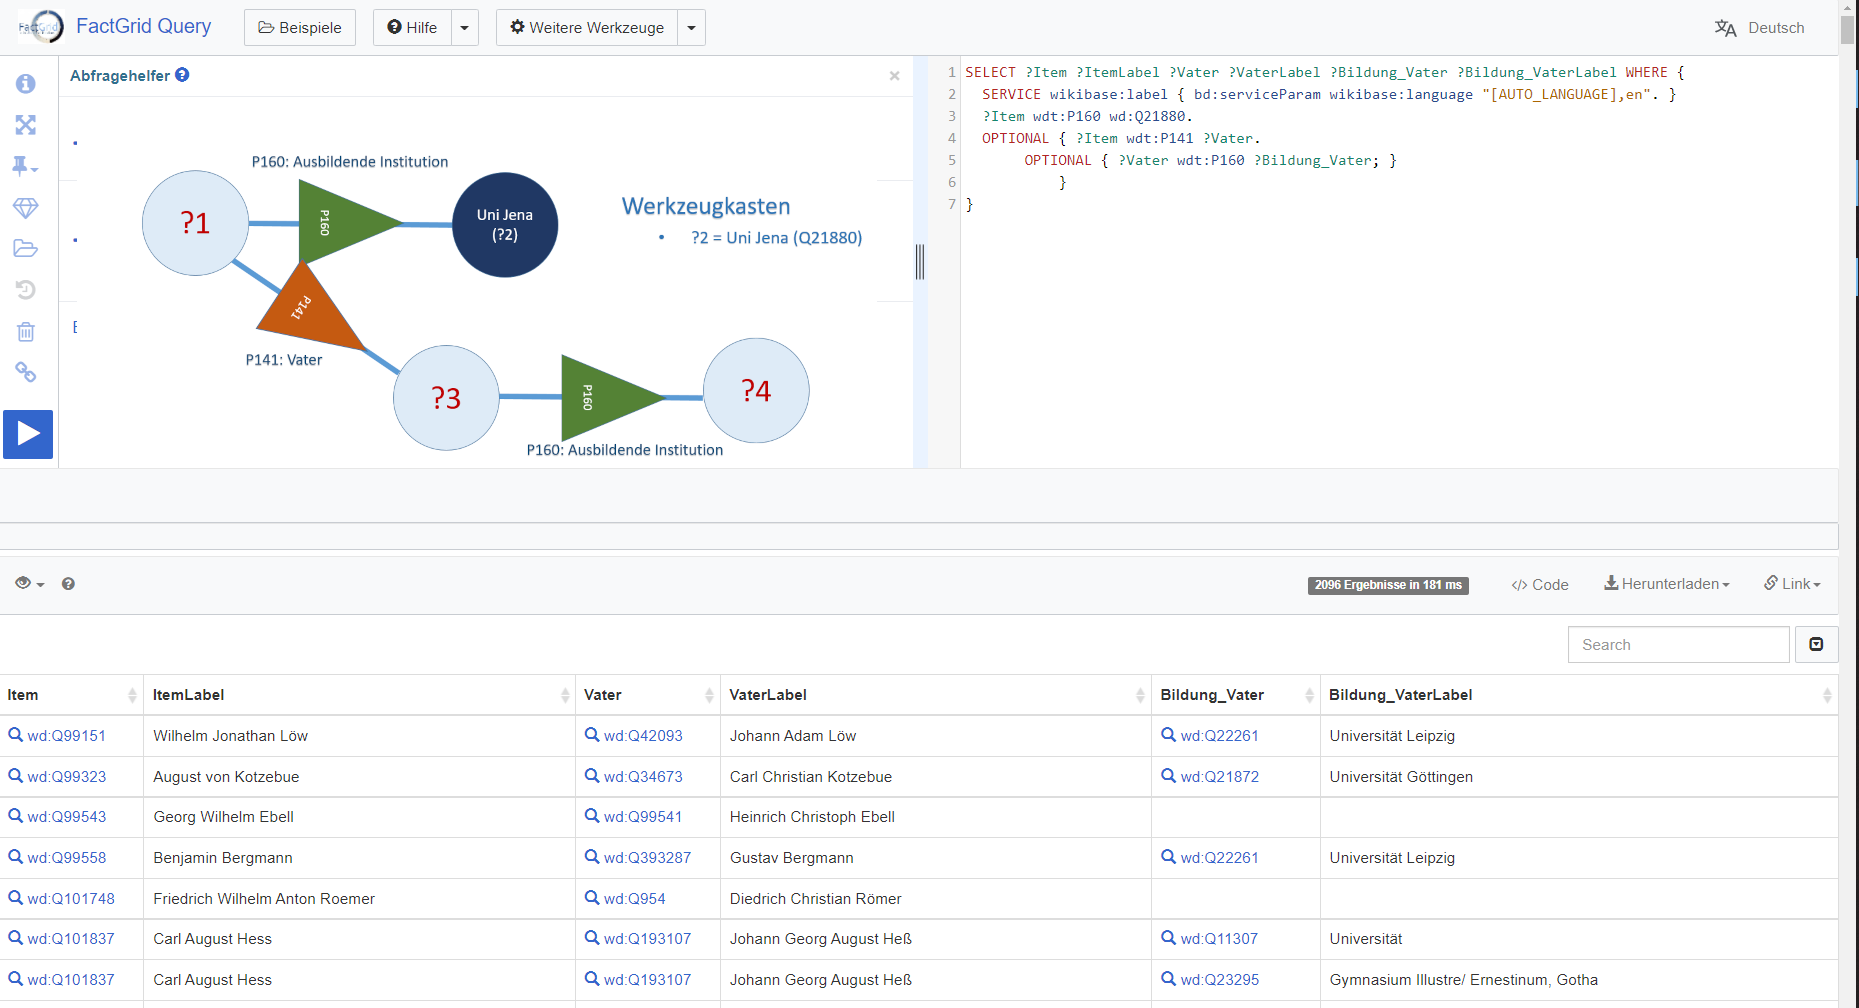
Man kann jede solche Anfrage nun beliebig erweitern etwa, indem man von den Studenten aus die Frage nach deren Vätern (P141) stellt, sie sollen hier in Tabellenspalte 3 gelistet werden:

Und man könnte nun sehr einfach den Schritt tun, der mit dem aktuellen Abfragehelfer so leicht nicht mehr zu machen ist: die nächste Frage an die Väter ansetzen. Von welchen (wieder P160) Institutionen wurden diese Väter eigentlich ausgebildet?

Man könnte die Frage auch kurzschließen, um zu erfassen, welche Studenten genau wie ihre Väter in Jena studierten:

Ich gab den Dreiecken verschiedene Farben, um sichtbar zu machen, wenn im Gefüge dieselben Fragen an verschiedenen Stellen gestellt werden (und damit strukturell ähnliche Gegenstände anspielen).

Optional / Verpflichtend

Vielleicht würde man in den Property-Dreiecken mit einem Ausrufezeichen notieren, wenn eine Aussage nicht optional, sondern verpflichtend für alle Funde gelten soll.

Qualifier

Qualifier müssten in der Visualisierung gar nicht viel komplexer sein. Hier wird jeweils ein einzelnes Statement zum Gegenstand neuer Statements. Wenn wir das graphische Repertoire schlank halten wollen, könnten wir die hinzukommenden Aussagen einfach an die vermittelnde Property binden – etwa, um bei den Studenten in zwei eigenen Spalten zu notieren, was die Qualifier P49 und P50 zu deren jeweiligem Studienbeginn und -Ende an dieser Uni notieren:

Filter und gezielte Darstellungen

Ich ließ in den letzten Suchen bereits den aufgeklappten Werkzeugkasten mitlaufen. Der nun sehr viel schlanker Befunde weiterverarbeiten. Eine Suche könnte etwa bei den Mitgliedern (P91) des Illuminatenordens (Q10677) erfassen, welchen religiösen Hintergründen (P172) sie entstammten. Bei einer Statistik, etwa einer Bubble Chart, würden wir die Zahl der einzelnen Treffer wissen wollen:

Denkbar nicht minder, dass man bei Zeitangaben Zeitfenster notieren kann, Werte die größer oder kleiner als angegeben sein müssen, um Befunde ins zeitspezifische Bild zu bringen. Spätestens bei solchen Suchen wird allen, die da schon einmal mit SPARQL hantierten und Aussagen verschachtelten klarer, dass der visuelle Query Editor sehr viel intuitiver und auch sehr viel viel schlanker erfassen würde, was einen bei einer Suche interessiert. Man würde damit spielen können, sich an Befunde herantasten können. Man würde es lernen, in den Datenstrukturen zu denken.

Mal so zum Nachdenken…

PS. Rechte und linke Maustaste – wie man im Visual Editor arbeitet

Wie würde man im Visual Editor seine Suchanfragen schreiben? Vielleicht ganz einfach: Mit der linken Maustaste setzt man einen Kreis mit Fragezeichen darinnen.

Klicke ich mit der linken Maustaste in diesen Kreis, kann ich dort etwas hineinschreiben und das Fragezeichen durch Text ersetzen.

Klicke ich mit der rechten Maustaste in den Kreis, scheinen grau vier Erweiterungsoptionen auf: Zwei Pfeile gehen von meinem Kreis weg, zwei Pfeile führen zu ihm hin. Jedes Mal gibt es zwei offene Angebote mit lediglich einem Fragezeichen darin, und zwei Angebote (zur Erklärung, was hier geschieht), bei denen Muster-Text gegeben ist:

Mit der linken Maustaste kann ich die Richtung meiner Wahl anklicken, diese erscheint jetzt farbig, die anderen drei bislang grauen Pfeile werden damit unsichtbar. Ich kann nun fortfahren und Fragezeichen (von Properties oder Items) durch Text ersetzen, oder auf einen Pfeil oder Kreis klicken und mir mögliche Erweiterungen von hier aus anzeigen lassen.

Wie im aktuellen Abfragehelfer erhalte ich immer eine Vorschau von 20 Zeilen Tabelle, mit der ich sehe, was ich hier soeben getan habe.