Imagine a Graph Query Helper for Graph Databases

[Link für Deutsche Übersetzung]

FactGrid is a graph database. If you run searches in such a database you should rather not think of a resource filled with interrelated tables (of people, places, organizations, documents…) – but of something more spatial, more geometric, more graphic.

Think of your own knowledge. You will not be able to give a table of all the names that have a meaning in your knowledge, or of all the places related to these names. Our knowledge is more like a web of interrelated objects. Nicolaus Copernicus? He is the man who wrote De revolutionibus. What else do you know? Maybe that he was born in Thorn, Polish Toruń, and that he studied at the Universities of Padua and Bolognia. I at least do not immediately know much more about the author who brought about the “Copernican Revolution”. That, of course, is an object that rings many more bells, with all the connections to other items of knowledge it has in my knowledge. I can add that these two universities were good places to study those subjects that were to become the natural sciences – but that again is knowledge on these objects, not on Copernicus, knowldge that got stuck in my knowledge as it added some more colour to my knowledge about Copernicus, the person. Think of interrelated objects hanging together in the wider mesh of your knowledge – of objects that link to each other like atoms in a molecule.

…an object with links to two other objects? That could be someone linked to her two parents. The graph would not look different if that was another person with his two daughters, or Copernicus with links to the two universities mentioned. Well, Copernicus studied at four universities, to be precise – but that is not the problem.

The problem is that the molecular model does not carry particularly well as it puts all the differences into the atoms, hence the various colours in images and the different connectivities of atoms in the typical three dimensional tool kits. In a database like FactGrid all the objects are structurally completely identical. They all are just “Items”: meaningless points, “nodes”, under Q-numbers counted up from 1 to infinity. The various and very specific Properties between the objects make all the differences in a graph database: “Fathers” are in FactGrid Items that have P141 “father” properties referring to them; mothers have P142 Properties linking from other items towards them.

In a triple-based database (which breaks down all knowledge into three-part statements) we will need no more than two sorts of components: You can take spheres for the objects of our knowledge, the “Items”, and arrows for the links that run between them – arrows as we have to express directions in the various statements.

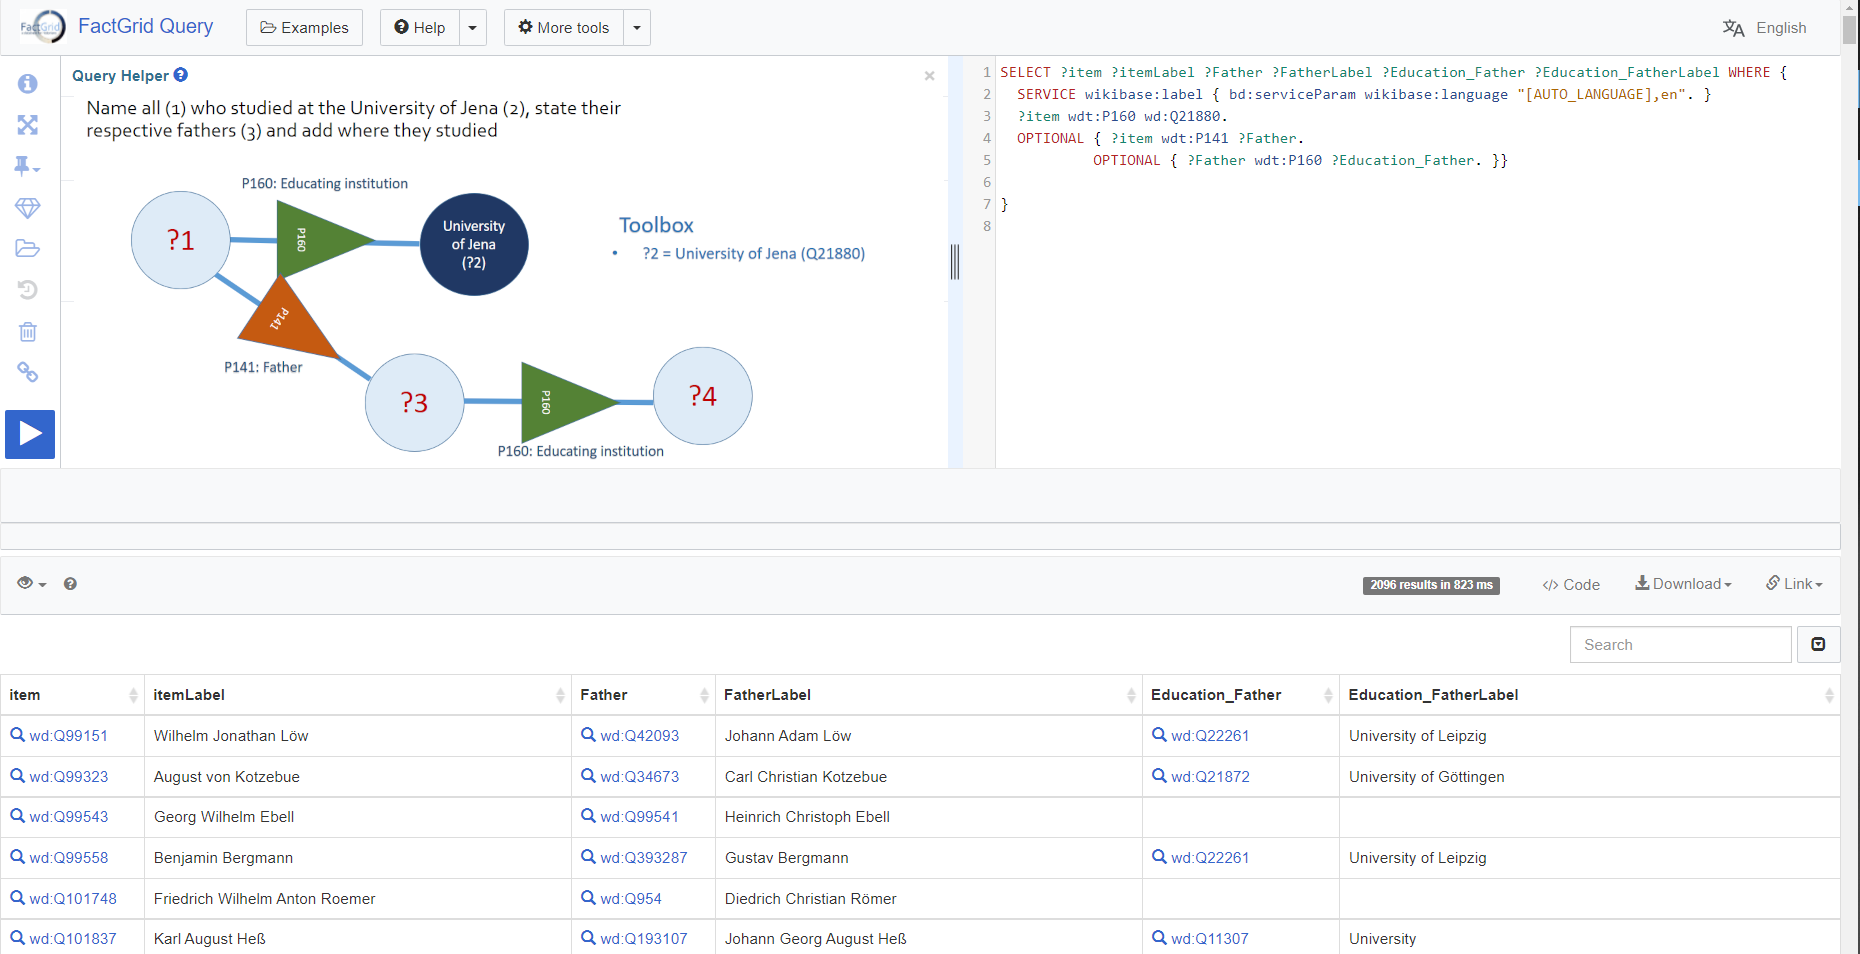
Those who studied at the University of Jena have P160 “educating institution” statements leading from their Items to the University of Jena Item Q21880. This is the SPARQL script (see this link to see what it does):

SELECT ?Item ?ItemLabel WHERE {
   SERVICE wikibase:label { bd:serviceParam wikibase:language “[AUTO_LANGUAGE],en”. }
   ?Item wdt:P160 wd:Q21880.}


SPARQL is a wonderfully versatile language to send searches through graph databases but it is impossible to script even this most simple query without handbook knowledge. What is worse: You will need additional knowledge of our database to know that Jena’s University has this the Q-number Q21880 and that students must have P160 statements on them that will link to this University with the Q21880 indetifier.

The Wikimedia Query Helper is the coolest gadget as soon as you understand what a “Filter” can do for you in your query. Once you realise that this is the input field that will need the university in your specific query you can start to type “Univ…” and the autocomplete will lead you to the Q-number you are looking for. Select the Item you are interested in and the tool will already propose the “who studied here?” Property P160 as this is the most used Property leading to Q21880. It is fair to assume you are looking for people who studied at this university.

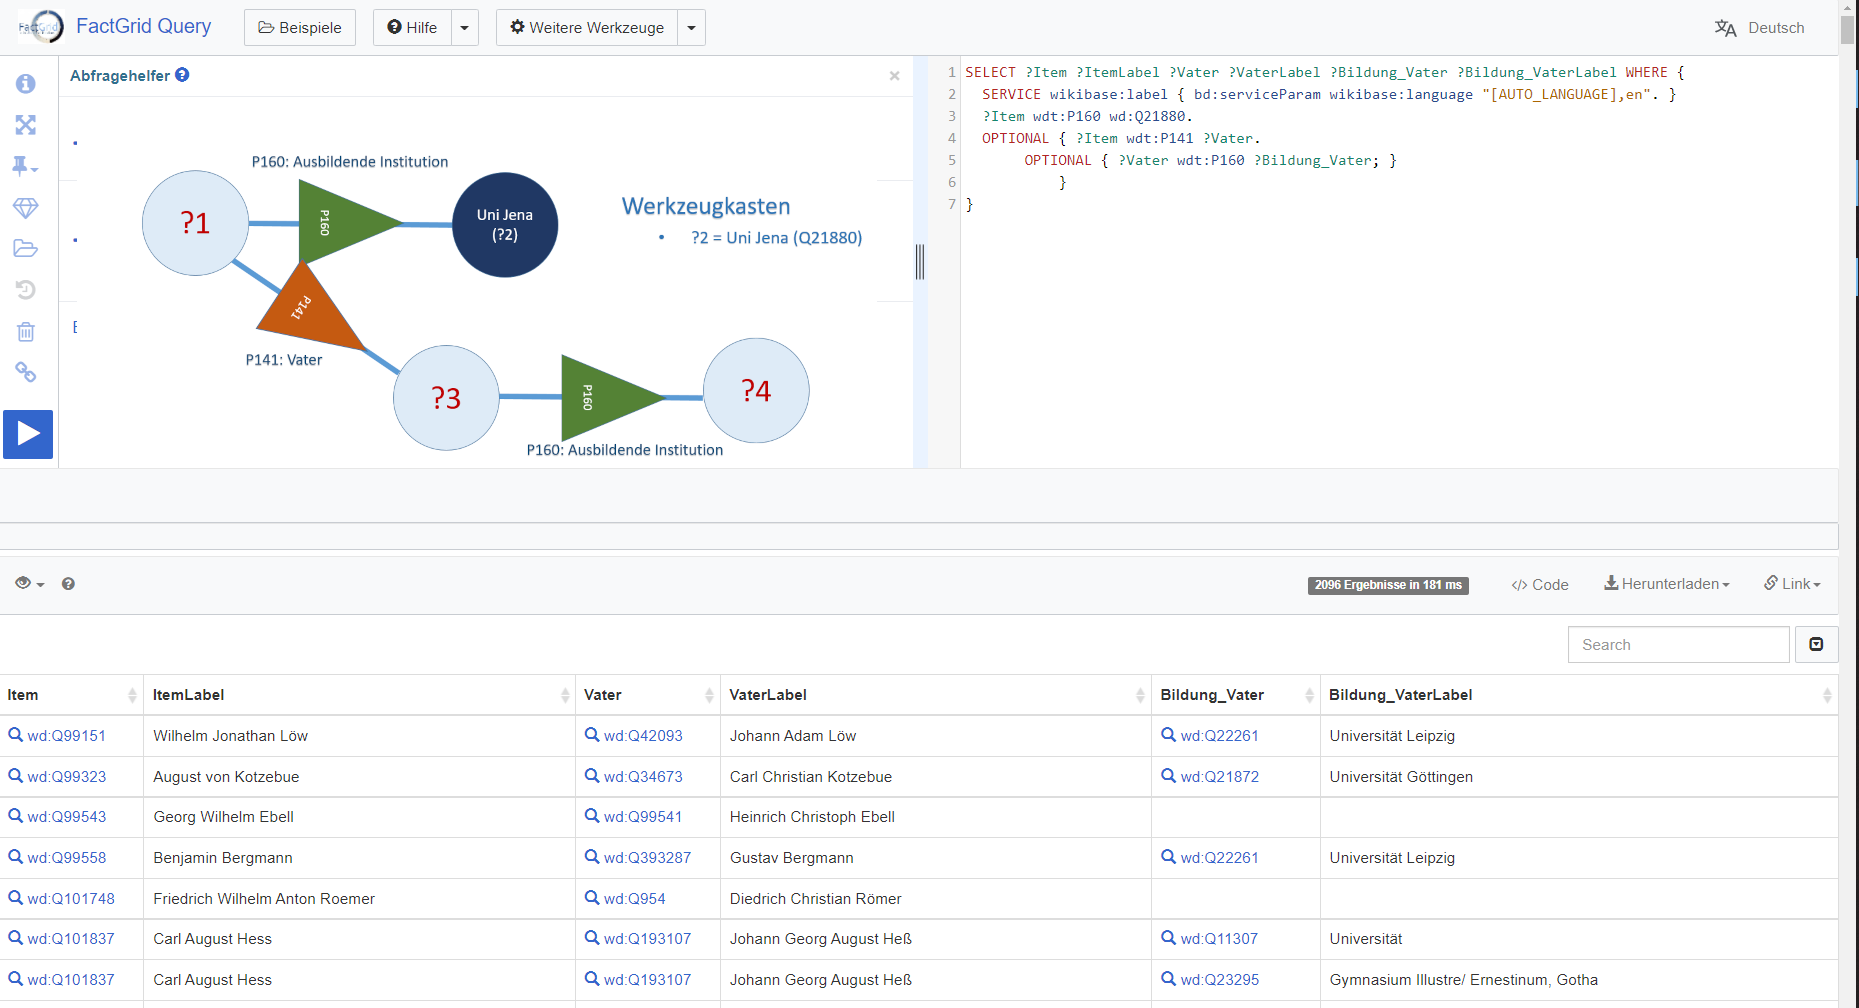
You can now ask for more information about these students as far as they are found on their Items, such as the dates of birth and death with both places in separate columns, and the names of their fathers and mothers. This is a search that uses the Query Helper:
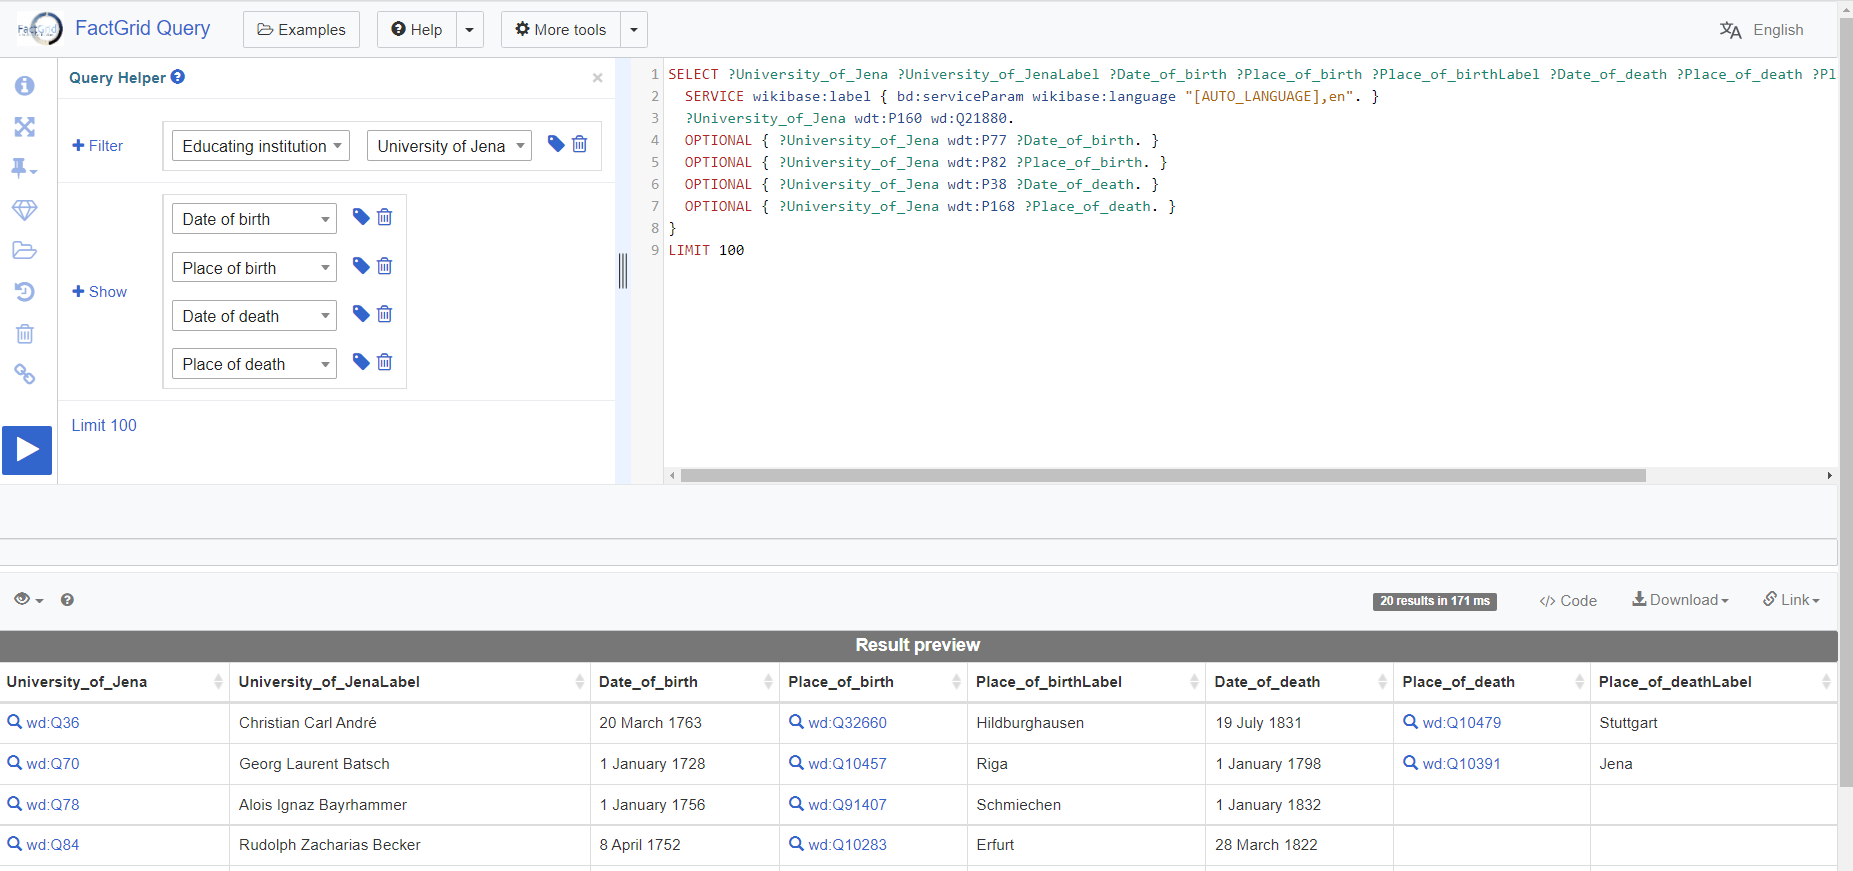

And this is where the present Query Helper will leave you. The coordinate locations of the places of birth are on their respective Items (not on the student Items which you have been exploring so far). You need these coordinates to get a map representation, but the Query Helper does not show you how to extend your search into the related objects, nor does it show you how to bring qualifiers into your list (like the matriculation begin and end dates stated with many of the P160 links). It is also difficult to switch to reverse questions. You already know the person and now you want to know more about him, while you are still asked to use a filter…

One should have a graphic – a visual – query editor on a graph database

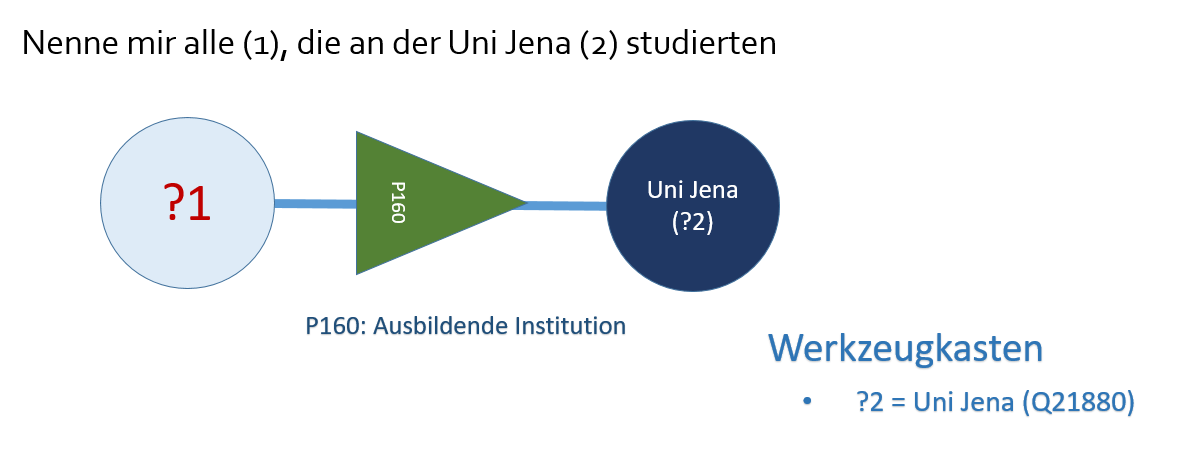
This is what the open question looks like: Who studied where? I put numbers in the circles to designate table columns.
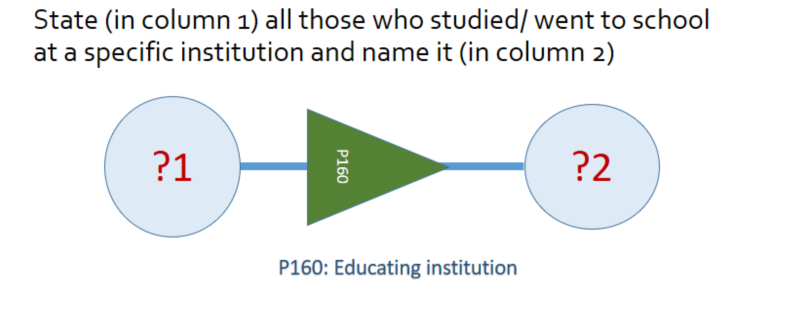
If you are only interested in Jena University students, you should be able to specify that right on the university’s Item. Click into its sphere and type “University of Jena” into the circle:

You can now expand the query as you wish with clicks into the objects or the arrows, for example by asking for the “fathers” (P141) of these sutudents, who will appear in column 3 (this script):

And it will now be easy to get more information from the fathers – like which schools and universities did the fathers attend, again P160 (script link)?

One could also formulate the short-circuit question to get all the students who studied in Jena just as their fathers had done before:

I gave the arrows in different colours because they are the components that make all the difference in objects. You want to spot identical questions and similar objects in your searches.

Optional / Mandatory

Perhaps a simple exclamation mark on the Property arrows would be enough to mark statements that shall work as filters.

Qualifiers

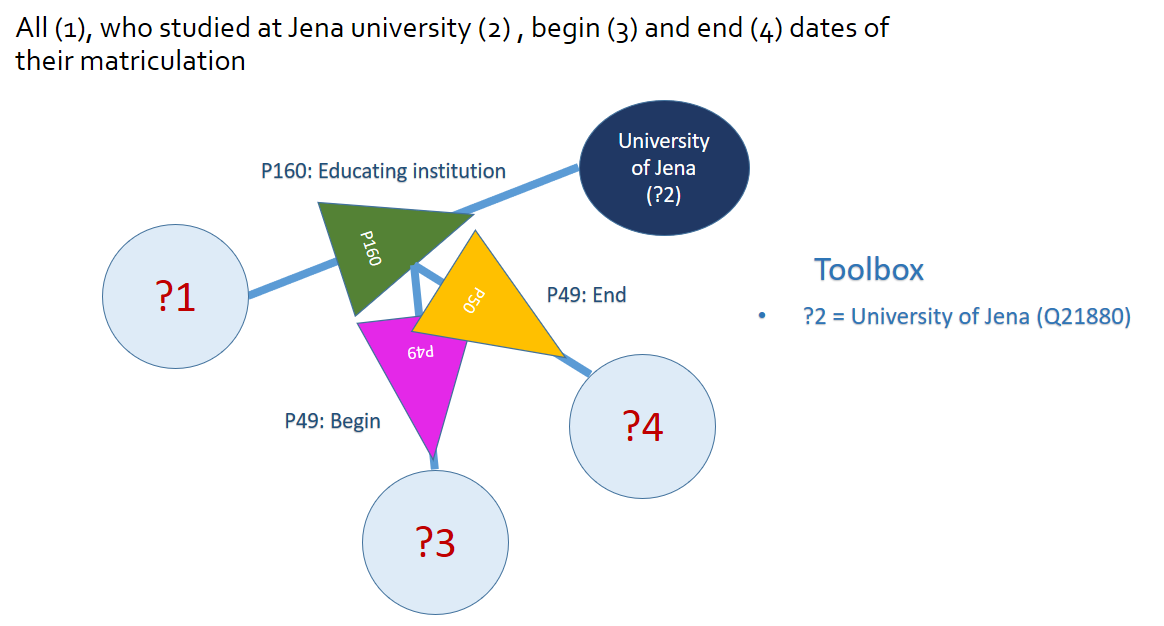
Qualifying statements are a bright Wikibase invention. Any primary triple can become the object of specific, qualifying statements. That is basically the relative clause we need in such a language (for instance if we have a person who studied at four universities and we want to say from when to when on each case). If we want to keep the graphic repertoire lean, we could simply link the qualifying statements to the Properties – for example, to get two separate columns for the begin and end dates of a specific university matriculation:
Opening the toolbox

The toolbox had been open in these various searches. I used it so far to state where a specific Item had a specific value attached to it. We would use this toolbox for all the more complex visualisations. Imagine you want to get the religious backgrounds of all known Illuminati in a bubble chart. Ask for the Items that have a P91 membership statement connected to the Illuminati, Q10677. Then ask for their religious backgrounds. If you want a bubble chart you need a count of hits on each religion and denomination:

The toolbox should also be the place to create time frames. You could here specify ranges on data you have requested.

Just a thought…

A Postscript on how to use the right and left mouse buttons in the query builder

Visual scripting might be actually quite easy. With the left mouse button you create your first circle. It will come with a question mark in it.

Click into this circle with the left mouse button, and you can put a value into this circle, a label; it will replace the question mark.

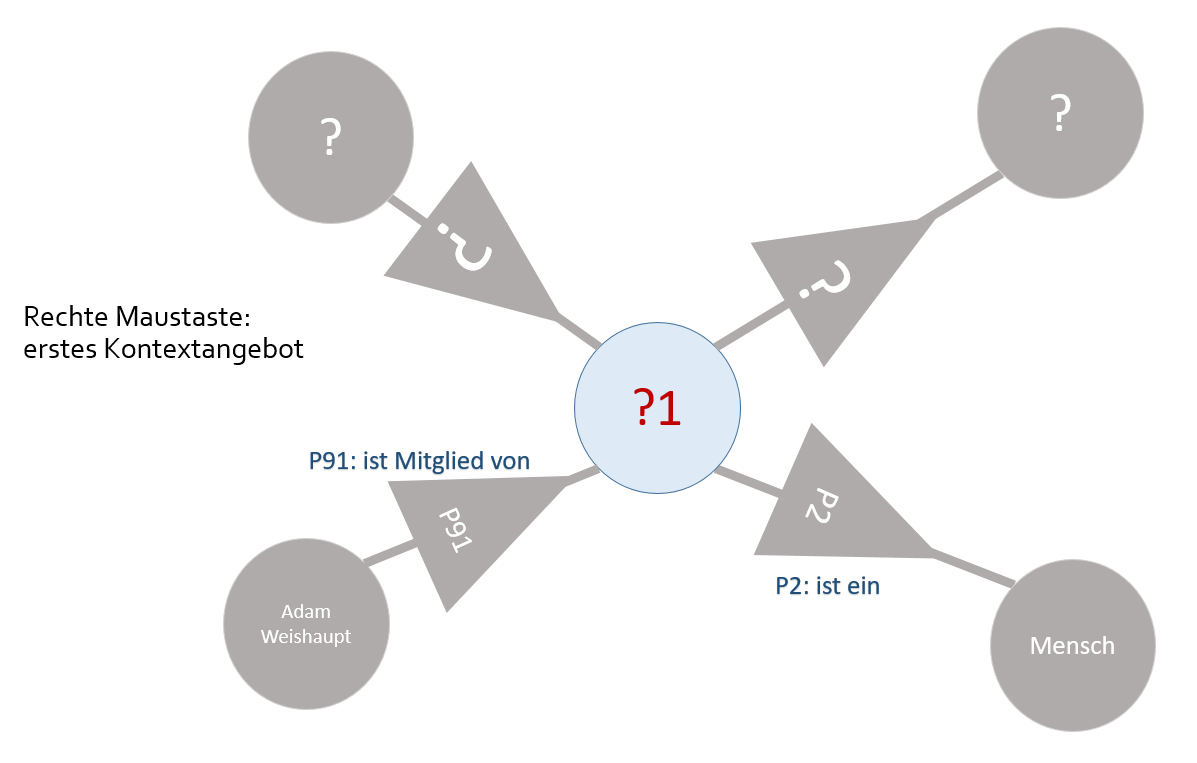
Use your right hand mouse button to get a visual context menu from his point. It will come in the form of grey options to select. Two arrows are leading away from your Item, two are leading towards it. Each time you get an open offer with question marks to replace (or to leave there) and two specific arrows that will give you ideas of what is happening here:

With the left mouse button you can select the direction into which you want to move, the selected arrow and circle will switch to colour, the other three arrows will disappear. You are now free to continue with a click into the next Item or Property of your interest. Just as in the current Query Helper, you will always get a preview of 20 table rows, that will give you an idea of the results you are about to get on your search.


Seen only later…

In einer Graphdatenbank müsste man eigentlich auch graphisch suchen können

[Link for English translation]

Das FactGrid ist eine Graphdatenbank. Das heißt, dass man sich die Datenlage in einer solchen Ressource besser nicht in Form von fünf oder zehn großen, aufeinander verweisenden Tabellen (zu Personen, Orten, Organisationen und Dokumenten etwa) vorstellt.

Das Wissen besteht in einer solchen Datenbank aus Wissensgegenständen – in Wikibase-Instanzen heißen sie „Items“ – und den Beziehungen zwischen ihnen, den „Properties“, sprich Eigenschaften, die diese Gegenstände an andere (oder auch an historische Daten, Links, Bild-Dateien oder Geokoordinaten binden).

Eine solche räumlich vernetzte Beziehung zwischen zwei Gegenständen kann man mit jedem Molekülbaukasten basteln. Hier ein Objekt mit Beziehungen zu zwei anderen. Das kann eine Person (die rote Kugel) sein mit Verbindung zu ihren Eltern (den beiden blauen Kugeln). Strukturell sieht das Gefüge aber nicht anders aus, wenn zu einer Person deren zwei Kindern erfasst sind, oder zwei Universitäten, an denen sie studierte.

Das Molekülmodell trägt nicht besonders gut. In einer Datenbank wie dem FactGrid sind alle Objekte vollkommen gleichartig. Sie alle sind monotone „Items“, die unter Q-Nummern hochgezählt werden. Erst die Aussagen zu ihnen bringen Unterschiede ins Spiel. Ein Vater ist jemand im FactGrid, wenn auf ihn von wo anders eine P141 „Vater“-Property verweist, auf „Mütter“ verweisen dagegen P142-Verbindungen.

In einer Tripel basierten Datenbank (die alles Wissen in dreigliedrige Aussagen zergliedert) genügen zwei Sorten von Bausteinen, etwa Kugeln für die Wissensgegenstände und, weil hier eben Bezugsrichtungen wichtig werden, Pfeile für die Verbindungen zwischen ihnen.

Alle Personen, die an der Universität Jena studierten, findet man, wenn man danach fragt, von welchen Items aus eine Aussage zur „ausbildenden Institution“ (P160) – auf das Item der „Universität Jena“ (Q21880) verweist. So (ausführbares Link) sieht die SPARQL-Suchanfrage aus, und die kann nun niemand so einfach „skripten“:

SELECT ?item ?itemLabel WHERE {
   SERVICE wikibase:label { bd:serviceParam wikibase:language “[AUTO_LANGUAGE],en”. }
   ?item wdt:P160 wd:Q21880.}

Wieso dies alles genau so zu schreiben ist, kann man ohne Handbuch nicht wissen, und man kann ohne Kenntnis der Datenbank auch nicht wissen, welche Q-Nummer man für die Jenaer Universität und welche P-Nummer man für die Aussage „hat hier studiert“ braucht.

Der Wikimedia Abfragehelfer (ist da bereits ein massiver Gewinn. Wenn einem klar ist, was man erreichen kann, wenn man zuerst „filtert“ und dann bestimmt, was einen an einzelnen Aussagen zu den herausgefilterten Objekten interessiert, kommt man mit dem Abfragehelfer erheblich viel weiter. In das Filterfeld kann man etwa „Uni Jena“ eingeben, ohne die Q-Nummer zu kennen. Der Autocomplete lenkt einen beim Eintippen komfortabel. Der Abfragehelfer ahnt bereits, dass einem interessiert, wer hier studierte – das ist die Property, die am häufigsten auf die Uni Jena verweist, sie kommt als erster Property-Vorschlag.

Wenn man nun mehr zu den herausgefilterten Studenten wissen will, kann man von deren jeweiligen Items Aussagen beziehen – etwa die Geburtsdaten, die Geburtsorte, die Sterbedaten und Sterbeorte, Väter und Mütter:

Es ist dies aber auch schon der Punkt, an der Abfragehelfer die Waffen streckt. Wenn man wissen will, wo die Orte liegen (um sie auf eine Landkarte zu spiegeln), muss man durch die Orte hindurch fragen, denn auf deren Items liegen die Geokoordinaten und hier hilft einem der Abfragehelfer nicht mehr weiter.

Es ist ebenso wenig möglich, im Abfragehelfer einen Qualifier hinzuzusetzen, um etwa den Studienbeginn mit abzufragen. Auch die einfache Umkehr der Fragen ist nicht vorgesehen: Ich kenne eine bestimmte Person und will wissen, wo sie von wann bis wann studierte.

Eigentlich sollte zur Graphdatenbank ein Visual Editor gehören…

Man müsste Graphdatenbank mit Skizzen der Beziehungen zwischen den Objekten befragen können. Hier die banalste Frage nach Allen, die überhaupt irgendeine Ausbildungseinrichtung besuchten. Wer waren sie, und welche Einrichtungen waren das?

Wenn uns nur Studenten der Uni Jena interessieren, sollten wir das für die zweite Kugel notieren können. Man tippt in den Kreis oder stellt es mit dem Werkzeugkasten klar: der zweite Gegenstand in diesem Spiel soll die Uni Jena sein:

Man kann jede solche Anfrage nun beliebig erweitern etwa, indem man von den Studenten aus die Frage nach deren Vätern (P141) stellt, sie sollen hier in Tabellenspalte 3 gelistet werden:

Und man könnte nun sehr einfach den Schritt tun, der mit dem aktuellen Abfragehelfer so leicht nicht mehr zu machen ist: die nächste Frage an die Väter ansetzen. Von welchen (wieder P160) Institutionen wurden diese Väter eigentlich ausgebildet?

Man könnte die Frage auch kurzschließen, um zu erfassen, welche Studenten genau wie ihre Väter in Jena studierten:

Ich gab den Dreiecken verschiedene Farben, um sichtbar zu machen, wenn im Gefüge dieselben Fragen an verschiedenen Stellen gestellt werden (und damit strukturell ähnliche Gegenstände anspielen).

Optional / Verpflichtend

Vielleicht würde man in den Property-Dreiecken mit einem Ausrufezeichen notieren, wenn eine Aussage nicht optional, sondern verpflichtend für alle Funde gelten soll.

Qualifier

Qualifier müssten in der Visualisierung gar nicht viel komplexer sein. Hier wird jeweils ein einzelnes Statement zum Gegenstand neuer Statements. Wenn wir das graphische Repertoire schlank halten wollen, könnten wir die hinzukommenden Aussagen einfach an die vermittelnde Property binden – etwa, um bei den Studenten in zwei eigenen Spalten zu notieren, was die Qualifier P49 und P50 zu deren jeweiligem Studienbeginn und -Ende an dieser Uni notieren:

Filter und gezielte Darstellungen

Ich ließ in den letzten Suchen bereits den aufgeklappten Werkzeugkasten mitlaufen. Der nun sehr viel schlanker Befunde weiterverarbeiten. Eine Suche könnte etwa bei den Mitgliedern (P91) des Illuminatenordens (Q10677) erfassen, welchen religiösen Hintergründen (P172) sie entstammten. Bei einer Statistik, etwa einer Bubble Chart, würden wir die Zahl der einzelnen Treffer wissen wollen:

Denkbar nicht minder, dass man bei Zeitangaben Zeitfenster notieren kann, Werte die größer oder kleiner als angegeben sein müssen, um Befunde ins zeitspezifische Bild zu bringen. Spätestens bei solchen Suchen wird allen, die da schon einmal mit SPARQL hantierten und Aussagen verschachtelten klarer, dass der visuelle Query Editor sehr viel intuitiver und auch sehr viel viel schlanker erfassen würde, was einen bei einer Suche interessiert. Man würde damit spielen können, sich an Befunde herantasten können. Man würde es lernen, in den Datenstrukturen zu denken.

Mal so zum Nachdenken…

PS. Rechte und linke Maustaste – wie man im Visual Editor arbeitet

Wie würde man im Visual Editor seine Suchanfragen schreiben? Vielleicht ganz einfach: Mit der linken Maustaste setzt man einen Kreis mit Fragezeichen darinnen.

Klicke ich mit der linken Maustaste in diesen Kreis, kann ich dort etwas hineinschreiben und das Fragezeichen durch Text ersetzen.

Klicke ich mit der rechten Maustaste in den Kreis, scheinen grau vier Erweiterungsoptionen auf: Zwei Pfeile gehen von meinem Kreis weg, zwei Pfeile führen zu ihm hin. Jedes Mal gibt es zwei offene Angebote mit lediglich einem Fragezeichen darin, und zwei Angebote (zur Erklärung, was hier geschieht), bei denen Muster-Text gegeben ist:

Mit der linken Maustaste kann ich die Richtung meiner Wahl anklicken, diese erscheint jetzt farbig, die anderen drei bislang grauen Pfeile werden damit unsichtbar. Ich kann nun fortfahren und Fragezeichen (von Properties oder Items) durch Text ersetzen, oder auf einen Pfeil oder Kreis klicken und mir mögliche Erweiterungen von hier aus anzeigen lassen.

Wie im aktuellen Abfragehelfer erhalte ich immer eine Vorschau von 20 Zeilen Tabelle, mit der ich sehe, was ich hier soeben getan habe.

The Illuminati Correspondence Fast Forward

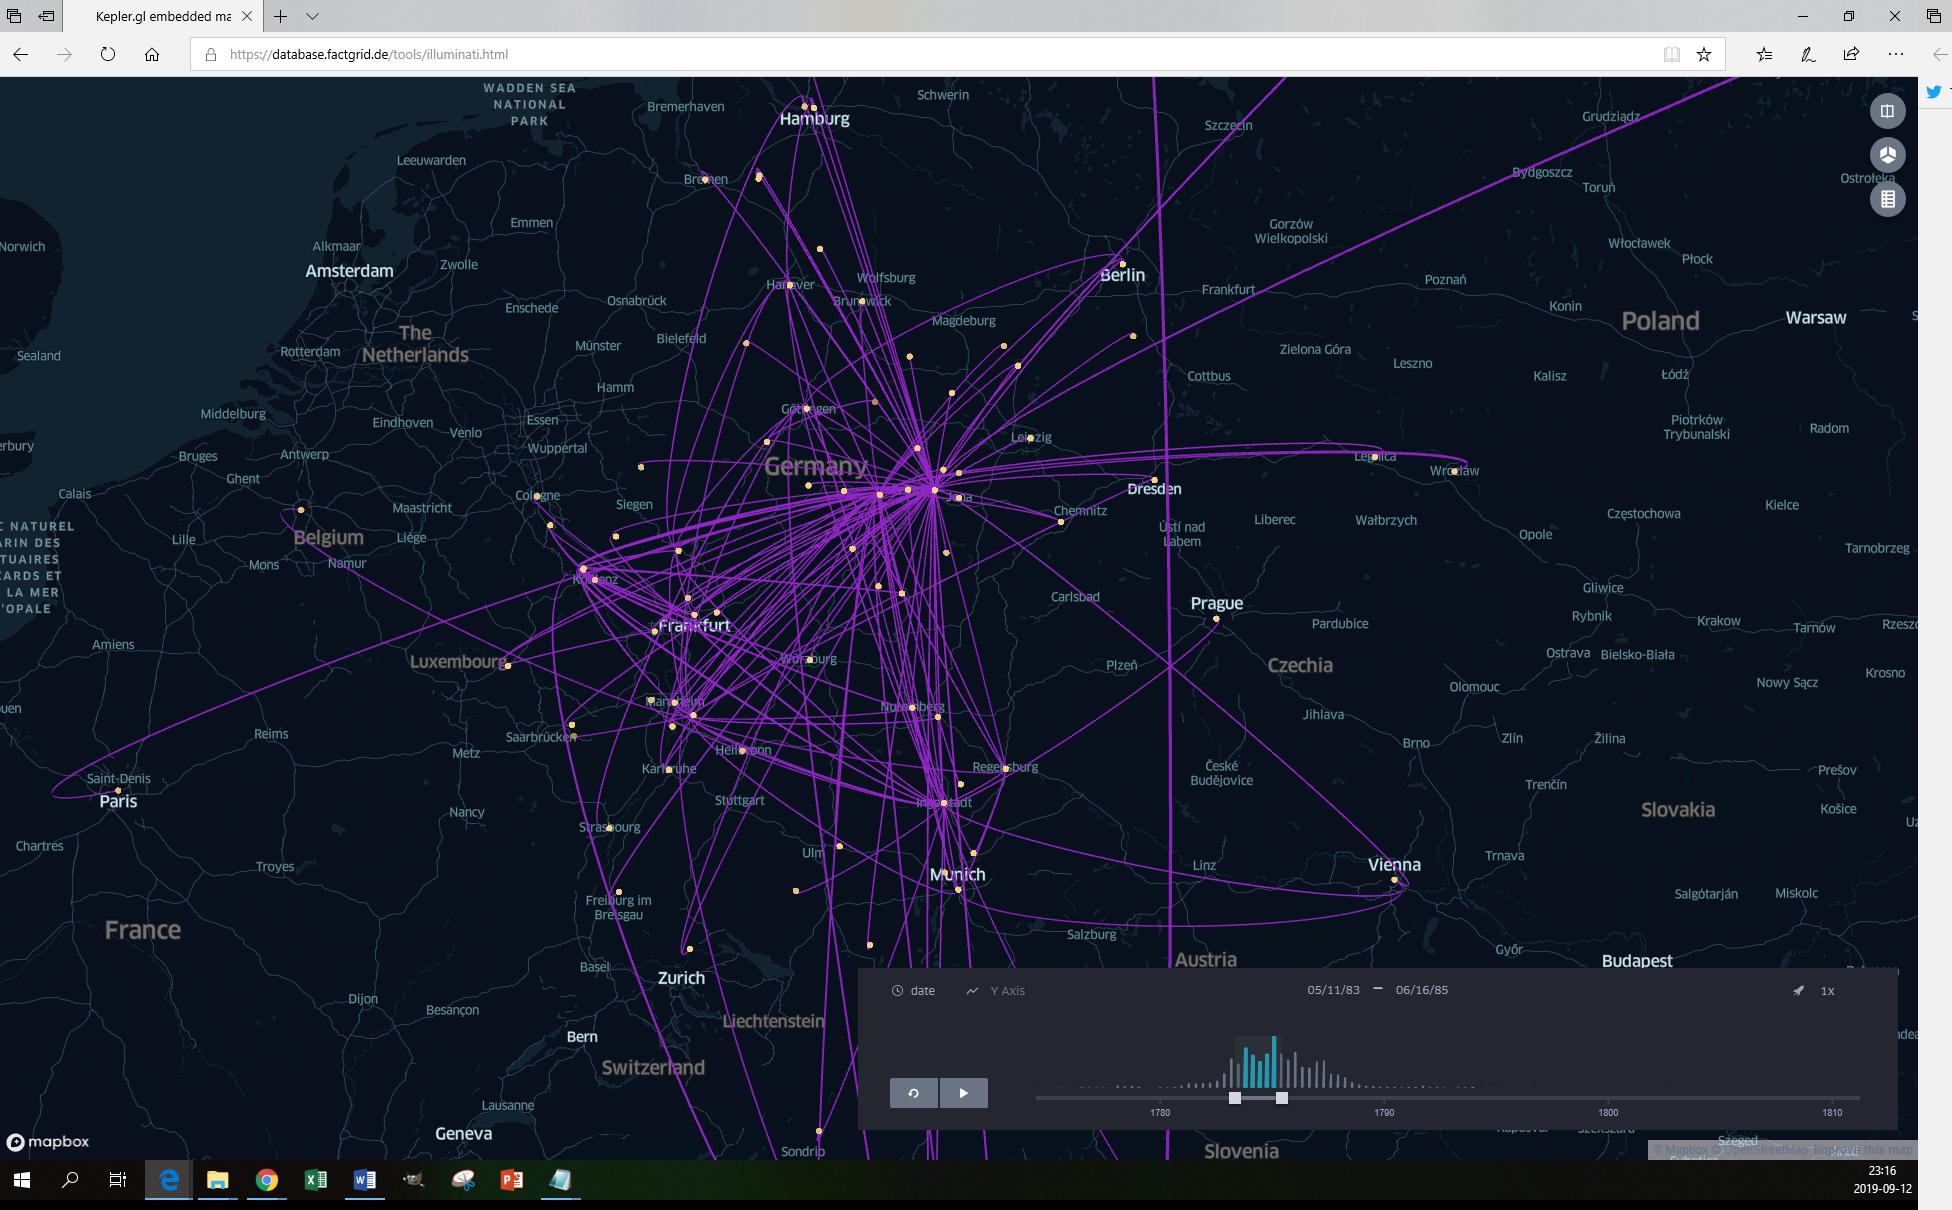
Paul-Olivier Dehaye scripted this visualisation for us (using Uber’s http://Kepler.gl). An html-file that captures all the Illuminati exchanges from the 1770s into the 1790s as far as we have spotted them (there are some misfits in this visualisation which we can now suddenly identify and which need to be eliminated on the database; the visualisation itself is basically a screenshot, it does not adapt to changes in the database).


<click to play>

The idea to represent letters in lines on a map together with a timeline on which the user can set a span that can then be shifted through the timeline – has become a classic in recent years: The Stanford Republic of Letters project seems to have been the first to come up with this visualisation ten years ago

Nodegoat is offering this visualisation as a standard aplication.

The visualisation is cool for correspondences since letters happen to travel on maps from senders to recipients (or to multiple recipients as soon as letters are forwarded – a standard procedure in all hierarchical Illuminati exchanges).

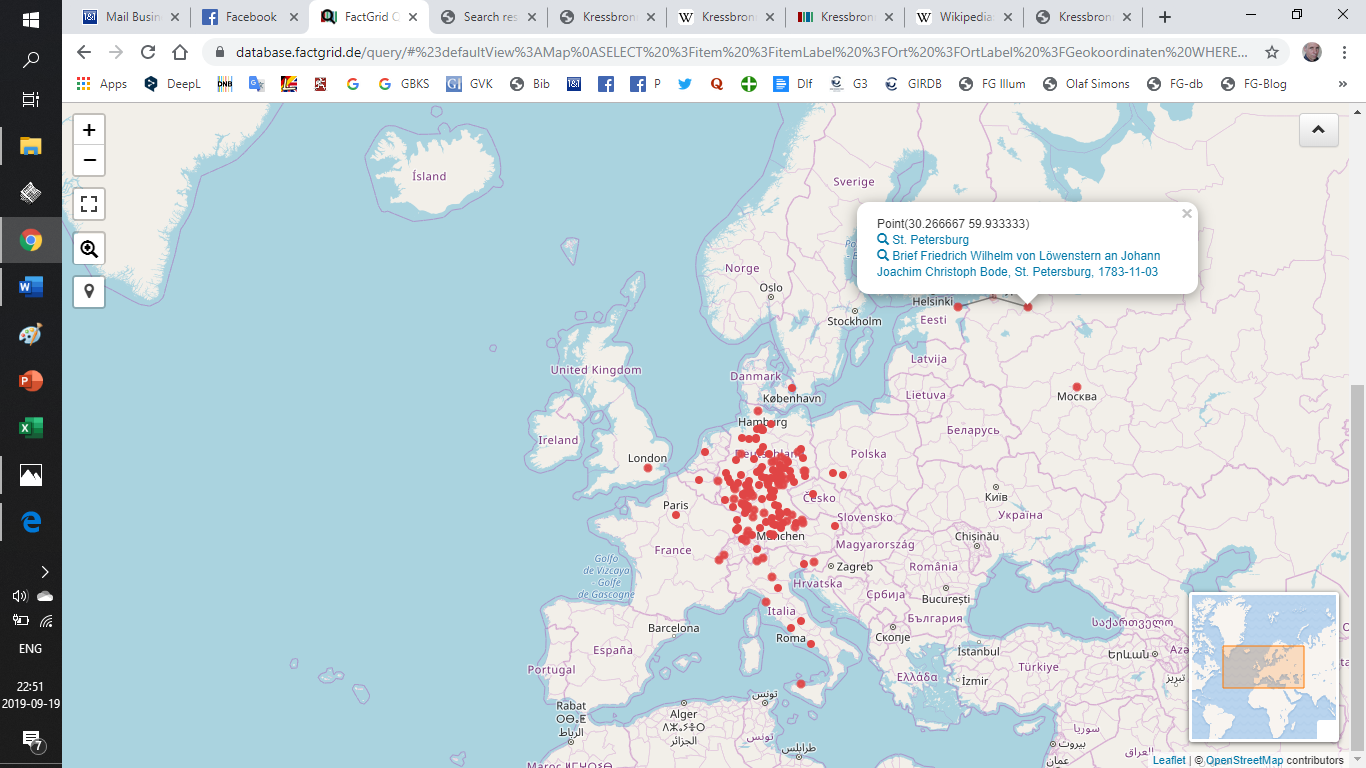
The simple visualisation which the SPARQL query service had yielded was already interesting to look at:

Illuminati Letters – sent from where?

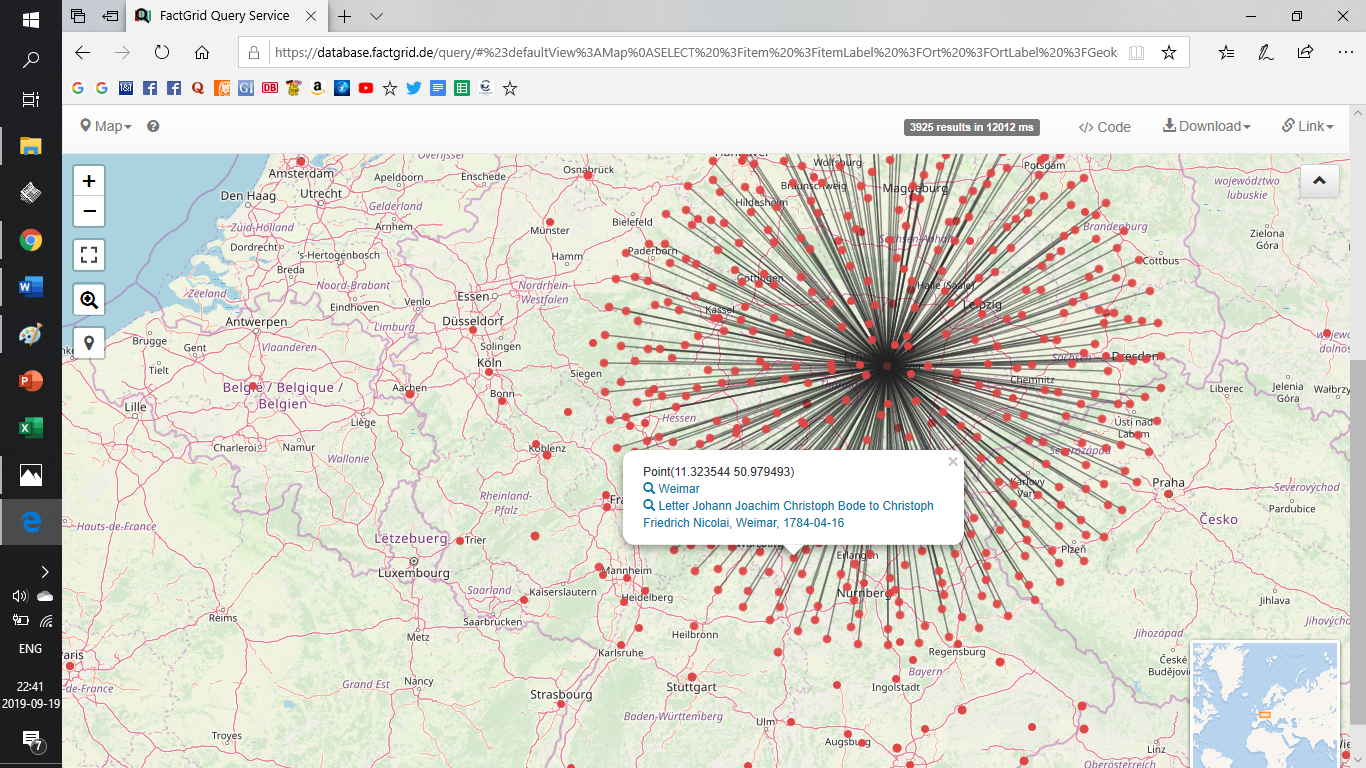
It showed the sender’s places of all known Illuminati letters and vaguely hinted at the Illuminati centres in Germany. But the picture remained static. It lacked the directions and the historical drama. You got more information if you clicked at an individual dot – usually this would open just a speech bubble with information about the particular letter that created this dot. But here and there one would see far more: a dot sparkling a fireworks of dots as in the case of Weimar (from where Christoph Bode organised the Order as the de facto leader after 1785/86). The beautiful bouquet is otherwise misleading – the dots do reach out to the various destinations; they stand for quantities which you only see if you hit the right dot (and which then obliterate much of the rest of the picture).

Bode’s Weimar correspondence – a nice representation of the number of documents but not much more.

Letters – that is the charm of the more refined temporospatial visualisation – tend to come in correspondences and these evolve, they stretch out, they blossom, and they die eventually.

The Illuminati are an almost ideal object for this particular visualisation as they present a full case to study. The “Republic of Letters” had remained out of reach for the Stanford project. The thing which we today prefer to call “academia” or “scientific community” was far bigger than the carefully selected and spectacular cases that created the first visualisations in 2009 — and only the whole picture would have revealed the evolution of our present academic debates between the 1480s and 1800. Regions and emerging nations brought forth increasingly scattered cultures of learning and they invented modern national topics such as our present debate of (usually national) literature. The spectacular exchanges could not possibly reveal these developments.

The Illuminati correspondence is, admittedly, no longer complete. We are looking here basically at the archives of Weishaupt and Bode and the Bavarian publications of 1787 – but it is even in this selection a clearly and well defined object. You know when you have an Illuminati letter in front of you: The author uses code names and the (messy) Illuminati-Persian calendar. The Organisation created complete genres of letters such as the monthly “Quibus Licet” which every member had to hand in and which would be answered with a “Reproche” signed by “Basilius” two months later. The genres are as remarkable as the internal affairs discussed in these letters.

The Order itself was at the same moment basically a complex correspondence: an organisational construct that generated a particular and unstable flow of information. Paul’s time lapse encapsulates the history and the drama of the Illuminati: For about two years – from 1776 to 1778 – we see very little: Ingolstadt is the place where Weishaupt’s “Perfectibilists” could organise most of their affairs in face to face meetings.

The situation changed dramatically in 1778: The Illuminati opened a lodge in Munich and started to infiltrate the masonic world.

Again two years later, in 1780, we see Adolph Freiherr von Knigge rising with exchanges he is now maintaining from Frankfurt and then from Heidelberg.

Knigge wins Bode for the Order in September 1782 and Bode in turn resolves the escalating conflict between Knigge and Weishaupt in 1784 and 1785: Knigge is forced to withdraw but Weishaupt does not regain his former position as the head of the organisation. Bavaria exposes the Order in 1786/87 with the first two editions of intercepted Illuminati documents. Weishaupt flees to Regensburg and then to Gotha where he ends in personal ignominy while it remains Bode’s part to come to the conclusion that he would not reform the secret organisation which could no longer claim to be a secret society.

You can pinpoint the individual letter to see who was writing here to whom with what letter exactly

Paul’s abstract movie wants to be explored. You can define the time frame and push it manually through the timeline, and you can click at each line to see whose letter is creating it. We can now see the overall quantities and the processes, the organisation’s actual growth and collapse on the map.

Far from perfect

The visualisation is state of the art and yet not much more than a show case at the moment. It is neither created in ever fresh queries nor can you use the html-page without some coding for your own questions.

The message, however is clear: The interface one would love to have with this visualisation could be far more simple than the present SPARQL query service. One would design it to always explore “correspondences” (P122Q11243) and one would ask the user for simple P—Q specifications of his or her desired visualistion. In the Illuminati case this would be:

  • Research Interest (P97) — Illuminati (Q10677)

One might just as well ask for “author” and name a couple of authors, or for recipients, but the Interface would do the rest and run the SPARQL query of correspondences to generate a list of the letters in question with senders’ and receivers’ places and dates.

Paul’s message is that this can be done: The centre of his html file is basically a SPARQL-search from our database. Maybe someone will script the interface during the Wikidata.con next month in Berlin.

And one would love to have more…

  • Think of a visualisation that tracked the movements of people on maps and that captured the moments when people (could have) met.
  • Think of a visualisation of the dissemination of objects – like copies of a specific edition.
  • Think of the spread of an organisation like Freemasonry with its mother lodges and filial branches.
  • Imagine a visualisation that traced your ancestors with a look at genealogical data.

Wikibase instances should invite the production of interfaces that can do certain jobs without bothering the user with SPARQL or Java proficiency. The cool thing about Wikidata or FactGrid is that these instances develop their (more or less) static ways to organise core data. We get more data but we continue to make the same useful statements especially if we have visualisations asking for these statements to be made with certain P- and Q-numbers.

Nodegoat would not lose any its charm if we began to offer similar visualisations; it will remain the software for the vast majority of projects that prefer the exclusive environment on which they can run exclusive and definitive presentations of their data. Wikibase instances are already very different beasts: They invite projects that want an open and growing landscape of data, and these projects will show the far bigger need of standard visualisations (i.e. of visualisations that use existing data and existing data structures). Projects on FactGrid or Wikdata need interfaces that already speak SPARQL. Time then to look at the more complex visualisations that are already running in environments such as the Stanford Republic of Letters Project or the Cultures of Knowledge Project in Oxford. We should act as the coolest competitors in this field, gather inspiration with the aim to inspire in turn.

Needed thing #4: A module to state original claims (and published research)

The Problem

Original research means that we will (also) have to deal with statements that have not been published before. So far this is a huge problem for any researcher. Should she make a claim that was never made before – minutes after she found the archival record to substantiate the spectacular claim? You better wait until your book is out – which can take a couple of years, and if you still need a database to do your research you better work on a platform where your work is invisible until then.

The platform with immediate visibility of your work is at the same moment a massive advantage: If you publish the observation minutes after you made it, you will have made your claim and you can from now onwards refer to it. That, however, means that FactGrid claim has to be made publicly, visibly connected to your research, your name, with a specific URL that comes with a publication date.

The FactGrid must be able to turn any statement which is made on the database into a micro publication. You make the claim and you give the source with all the information about you including your evaluation and the details which any future research should continue to offer. The Wikibase Interface of our dreams should offer footnotes on each claim, every note nicely wrapped up for anyone to grab and to repeat in his own texts.

The more complex source attribution will have more advantages: It will allow researchers to fill the database with hypothetical statements. These will be marked as such and enter the test run, for you will now be able to see whether a hypothetical date (for instance) of a letter fuses into the data environment you are creating. You can immediately work with colleagues on a premise where you feared them as rivals who could steal your information.

Model solution

The FactGrid source attribution will have four sections. Users should be guided with drop down menus where possible. We generate a new Q-item to quote in the end:

Section 1: Published elsewhere or original research? (pull down menu plus input fields)

  1. This statement is already publicly circulating. (Input fields:) Q-number of the publication (plus field for more specific reference like a specific page number).
  2. This is original research to be credited as such. (Input fields:) Q-numbers of the researchers or team to be credited (plus date stamp and url to quote the entire module).

Section 2: the evidence

  1. Q-number(s) of the piece(s) of evidence (plus field(s) for detailed reference like page number(s)).

Section 4: evaluation (qualifier to the previous via pull down menu)

  • The claim can be taken for granted with the evidence given.
  • The claim is based on additional conclusions (stated in section 4).
  • No evidence given, yet the claim is generally accepted as fact
  • The claim is obsolete (for reasons discussed in section 4).
  • The claim is/was hypothetical (the assumptions are stated in section 4).
  • The claim is valid within the fictional universe.
  • The claim has a propaganda value.
  • The claim is part of a religious creed (see the discussion of section 4).
  • The claim is personal/family knowledge.

Section 4: discussion (link to the statement’s discussion page)

Use

The source statement will ideally contain all the information needed to (automatically) generate a footnote which can then be used by the Reasonator the FactGrid’s equivalent (see our needed thing #3), in any Wikipedia article or in any other publication referring to the claim.


Published also here: https://www.wikidata.org/wiki/Wikidata:FactGrid/Needed_thing_No._4:_A_module_to_state_original_claims_(and_published_research)

Needed thing #3: An attractive Interface for browsing and reading Wikibase information

The Wikibase software has been designed to serve underneath the +200 Wikipedia installations, it is offering its services in SPARQL-queries but it does not aim at people interested in the facts collected on an item of knowledge.

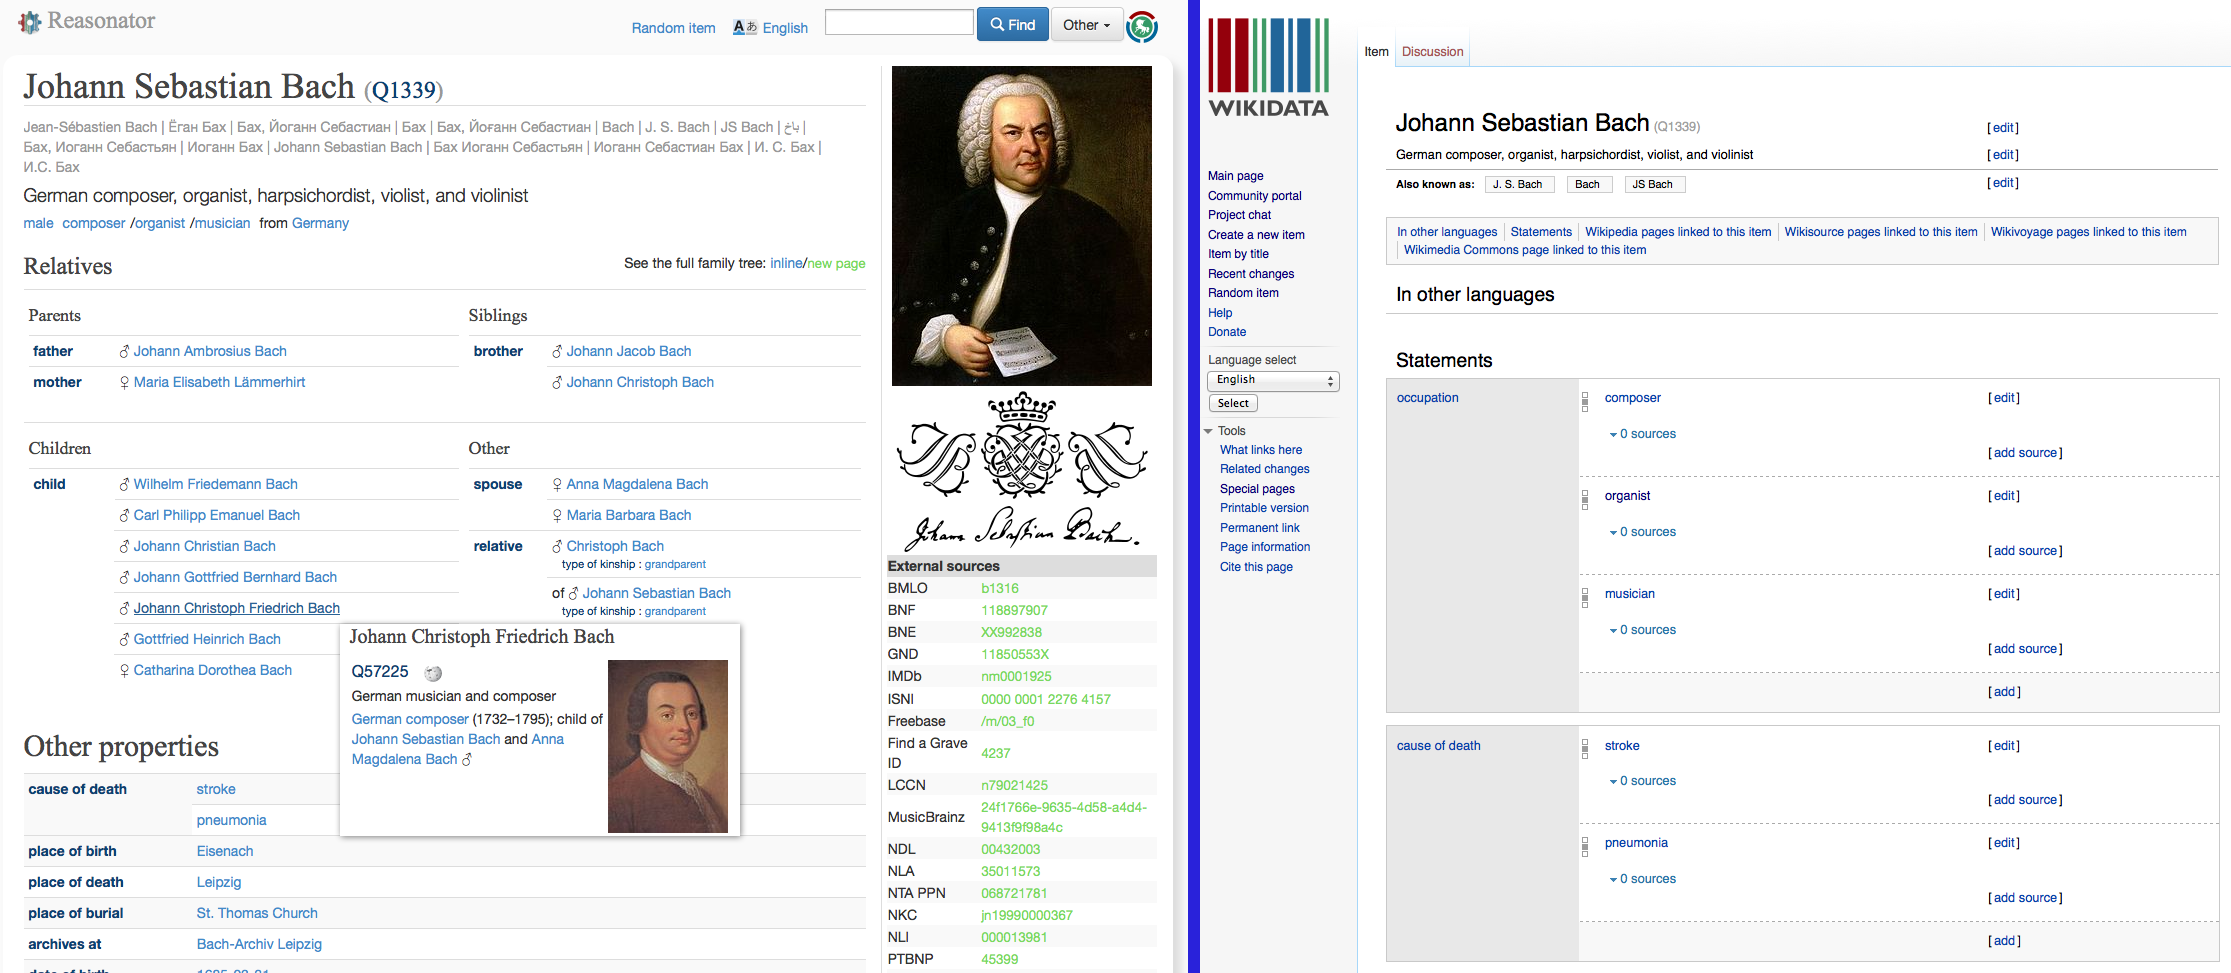
Magnus Manske’s Reasonator is the tool which turns Wikidata information almost into articles – in any language. The page on Q13339, Johann Sebastian Bach is, as it turns out, in many ways superior to the 200+ competing Wikipedia articles on Bach: It has one sinle source to be edited by users world wide. It shows at a single view what it has to offer – you do not crawl through well balanced sentences, which might not at all offer the information you are looking for.

But the Reasonator has its fundamental drawbacks: Technically you are on a platform that uses Wikidata information – not on the global Wikidata interface. Practically and organisation-wise you are on extraterritorial space when it comes to future developments. The Reasonator is Magnus Manske’s dream child. It is not part of the package Wikimedia will develop as the universal Wikidata front-end (because any such front-end would immediately rival the 200+ Wikipedias?)

The following thoughts aim at an “Interface” one would like to have with any Wikibase installation on whose and what technology whatsoever:

What the global “Wikibase Interface” should be able to do (and what it should avoid)

  1. Pages on items of knowledge (i.e. on Q-numbers of the installation) should not rival the written article (with automatically generated language statements).
  2. The interface should focus on the presentation of all the facts on a specific question. Get the first three entries of the list and get the complete list only if you click at more. Use the interface to get all the letters Leibniz has written, all the works composed by Bach, all the people Luther is known to have met plus dates and locations.
  3. An edit option leads from the specific statement on the Interface page to the specific Wikibase input section that is generating the statement.
  4. Users who are reading a biographical Interface page can press “edit via form” and they will be led to an input form for biographies with subsections to open. This is particularly useful on any page with fragmented and sparse information, since Interface readers will not necessarily have a clue what a Wikidata property is, and where to find it. They need inspiration of what questions they possibly could answer. See our Needed thing # 1: The technical solution that enables researchers to create input forms for the specific requirements.
  5. Any statement on the Interface page is referenced on page in a footnote (see Needed Thing #4: A module to state original claims (and published research)) so that users can grab the footnote and get it into the Wikipedia they are writing or into the research paper or book under their hands.
  6. The interface can present media and extended texts. A page on an archival document or 18th-century book must be able to offer the scans and a searchable text transcript (users who detect transcription mistakes must be able to correct the mistakes on the spot, through the interface). See one of our Illuminati-document pages for the requirement to be met.

Magnus Manske’s Reasonator is the Wikidata exploit that has taken the step into the data-driven alternative to Wikipedia articles. We should see the advantages: We leave the world of tediously constructed texts and all the confrontations these texts are bound to sparkle between want to be authors and offended readers. We get information that is actually generated in a global effort – where Wikipedia has been generating national communities so far with all their massive problems. We can aim at complete collections of facts. Do not press for “more” on a subject if you do not want to get the names of all the children Johann Sebastian Bach had – but use this source if that is what you want to know. We leave the debates of the various “notability” wars we are presently leading in or 200+ Wikipedias – the debates on what a respective “community” feels people should know, and what they feel one should not necessarily be bothered with.

We must reach the point where we see that Wikidata has actually merits of its own as a new additional source in the Wikimedia universe – and this is what Magnus Manske’s Reasonator has been doing almost in the shadow so far.

Links & More


Published also here: https://www.wikidata.org/wiki/Wikidata:FactGrid/Needed_thing_No._3:_An_attractive_Interface_for_browsing_and_reading_Wikibase_information

Needed thing #2: A logo and our own design

The facts all contribute only to setting the problem, not to its solution.
        Ludwig Wittgenstein, Tractatus Logico Philosophicus 6.4321

The FactGrid still needs its own cohesive design. The name is a modest allusion to Wittgenstein’s Tractatus and his idea that we see the world through a grid of factual statements. It was not that difficult to correlate this thought with images – looking backwards and a across cultural borders. The blog’s main page uses these changing images with humour and as inspiration.

That, however, is all we have at the moment – leaving a lot to be done. The different software platforms – our blog (WordPress), the Wikibase installation (Wikimedia design), and Magnus’ Manske’s Reasonator child do not really go together design-wise.

  • The project does not have a logo.
  • We are presently using Corbel on the FactGrid’s blog, a font with space to breathe, modern with its sans serif design and yet conservative with its medieval numerals and ligatures… is there an open source alternative? And: do we need to go open source with the font?
  • The database still has the Wikidata design (and basically the design of all the central Wikipedia projects). The blog is more in the direction to go. The database should, however, stay in close contact with its wikibase mother, so that anyone working primarily on the mother project can immediately feel right at home on our platform.
  • The FactGrid’s Reasonator interface should enjoy greater freedom to adopt a unified design since we are here mostly interested in an interface that represents information. We should here go for a design that is open to bigger representations of maps, images, models of objects, since our projects will be forced to produce show cases.

These remarks are will not yet serve as a specified task book, they should rather set a direction.


Published also here: https://www.wikidata.org/wiki/Wikidata:FactGrid/Needed_thing_No._2:_A_logo_and_our_own_design

Needed thing # 1: The technical solution that enables researchers to create input forms

Wikidata’s Wikibase installation has been filled almost entirely in massive automated data inputs. That is probably why input forms were not exactly the first priority.

Our database will focus on researchers and regular users whose tasks will call for modules which they can get used to. The historian might sit in an archive with the task to register some 200 documents of a law case. The documents have to be dated, information about authors, the institutions, and addressees has to given on each document. The private user might want to give biographical information about a distant family member with the aim to augment his family’s genealogy. Both are used to input forms. They will never have heard of “triples”, their ideas of “properties” will be inappropriate, they will not be able to use complex Excel-commands in order to prepare an input via QuickStatements.

Requirements

What we need is a technology which enables projects to create their own input forms:

  1. Research projects must be able to define and modify such input forms – using the properties they have created or found on the database.
  2. It should be possible to define and explain the particular input field – whether this field calls for an item (with a Q-number), a date or a numeric value etc. Predefined pull down menus will be particularly useful in a lot of cases.
  3. The ideal input form will give indications whether an item is already in the database by auto-completion and through suggestions.
  4. The tool should be able to create database items with new Q-numbers on a first input.
  5. It must be possible to return to a form and an item of interest once fresh information can be added so that bigger teams or a crowd can work in successive sessions on the same items. The Q-number could be the entry point.
  6. We should be able to nest forms, that is to include specific modularised forms in a bigger form: A biographical input will open with basic questions and it will then offer specific modules on the genealogy, places the person has lived and visited, education, degrees, memberships or works. A membership module for the Illuminati will differ from a membership module for the British House of Commons since being a member will raise altogether different questions in either case. The option of specific modules is necessary since we might get rare but complex options of interest to specialists only and since we should be able to duplicate entire modules: If a person is employed by different companies we get the same questions open again: From when to when? Which company? Where stationed? What position? What salary?

Use cases

Biographies will be the most interesting test field. Most users will have augmented their own CVs with biographical information more than once in their lives.

The document description will be the most interesting input form for historians to use – and a use case of its own practical value. We would test here the use of the database at the entry point where knowledge is produced with a tool that should be more handy than the usual individual word files which researchers are using for excerpts and random bits of information. The FactGrid document description could be used by archives in turn to gain the metadata users usually generate for their own purposes.

Status

Erfurt University funded a prototype development (see: https://database.factgrid.de/wiki/Web_Forms). We became able to generate input forms on the platform, smoothly using any properties a research team would gather on a specific module. It turned out to be more difficult to access such a form again at a later stage (as described in requirement 5 above).


Published also here: https://www.wikidata.org/wiki/Wikidata:FactGrid/Needed_thing_No._1:_The_technical_solution_that_enables_researchers_to_create_input_forms