The Illuminati Correspondence Fast Forward

Paul-Olivier Dehaye scripted this visualisation for us (using Uber’s http://Kepler.gl). An html-file that captures all the Illuminati exchanges from the 1770s into the 1790s as far as we have spotted them (there are some misfits in this visualisation which we can now suddenly identify and which need to be eliminated on the database; the visualisation itself is basically a screenshot, it does not adapt to changes in the database).
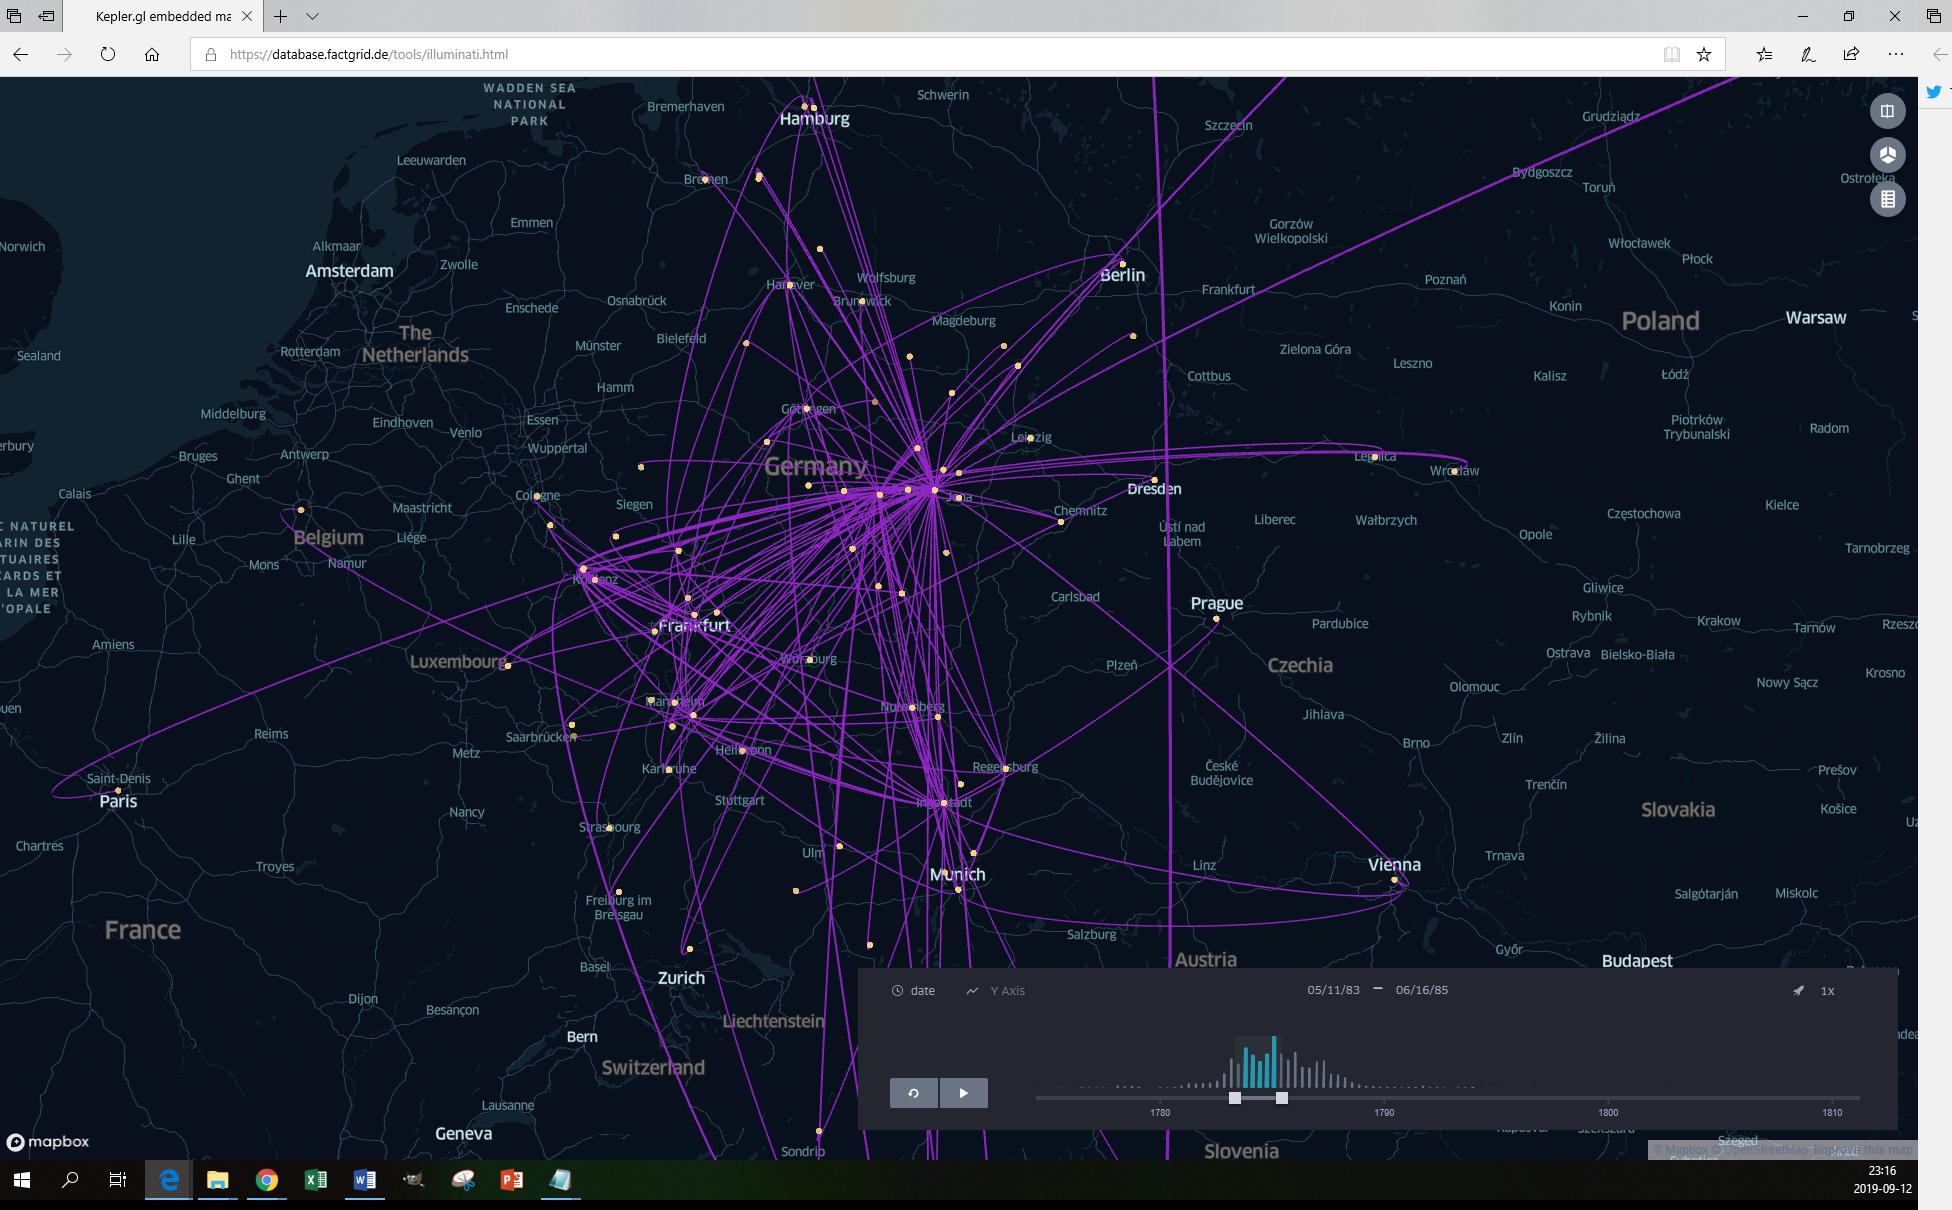

<click to play>

The idea to represent letters in lines on a map together with a timeline on which the user can set a span that can then be shifted through the timeline – has become a classic in recent years: The Stanford Republic of Letters project seems to have been the first to come up with this visualisation ten years ago

Nodegoat is offering this visualisation as a standard aplication.

The visualisation is cool for correspondences since letters happen to travel on maps from senders to recipients (or to multiple recipients as soon as letters are forwarded – a standard procedure in all hierarchical Illuminati exchanges).

The simple visualisation which the SPARQL query service had yielded was already interesting to look at:
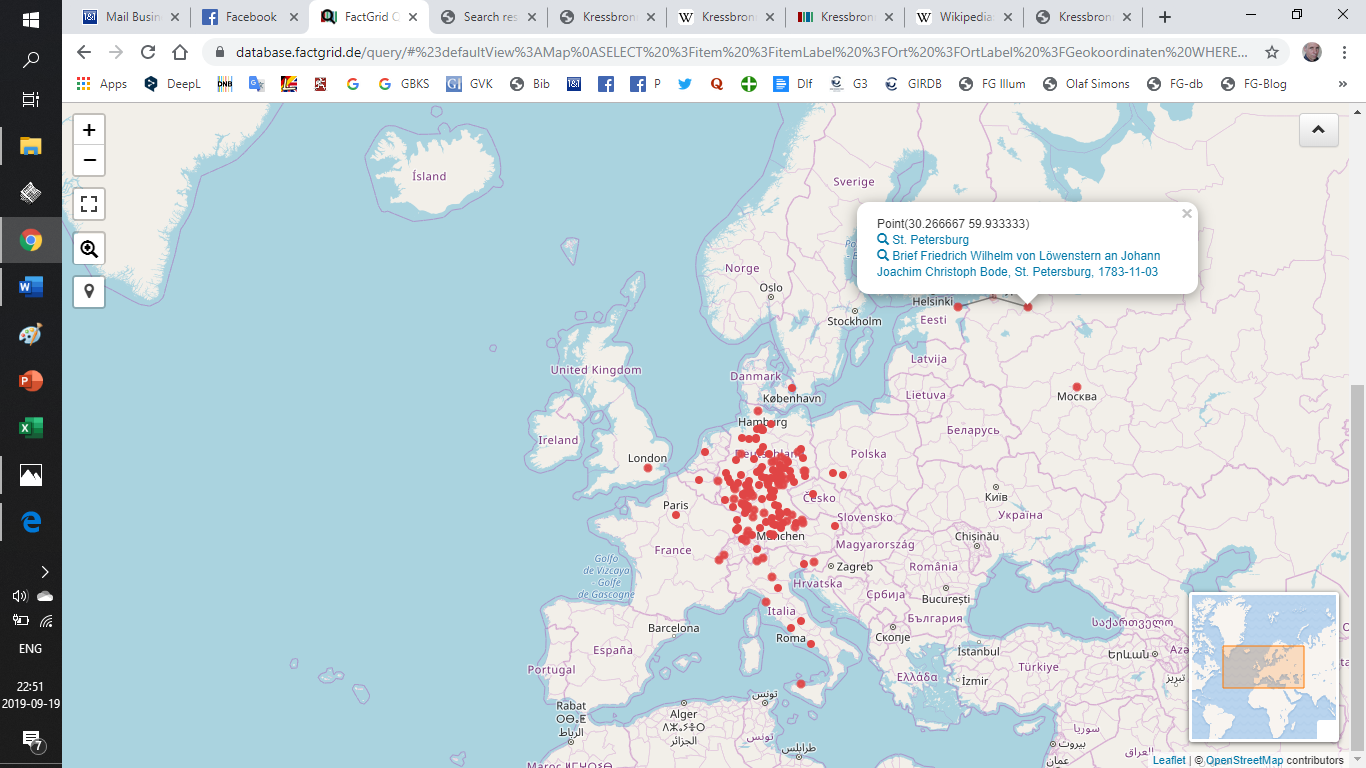
Illuminati Letters – sent from where?

It showed the sender’s places of all known Illuminati letters and vaguely hinted at the Illuminati centres in Germany. But the picture remained static. It lacked the directions and the historical drama. You got more information if you clicked at an individual dot – usually this would open just a speech bubble with information about the particular letter that created this dot. But here and there one would see far more: a dot sparkling a fireworks of dots as in the case of Weimar (from where Christoph Bode organised the Order as the de facto leader after 1785/86). The beautiful bouquet is otherwise misleading – the dots do reach out to the various destinations; they stand for quantities which you only see if you hit the right dot (and which then obliterate much of the rest of the picture).
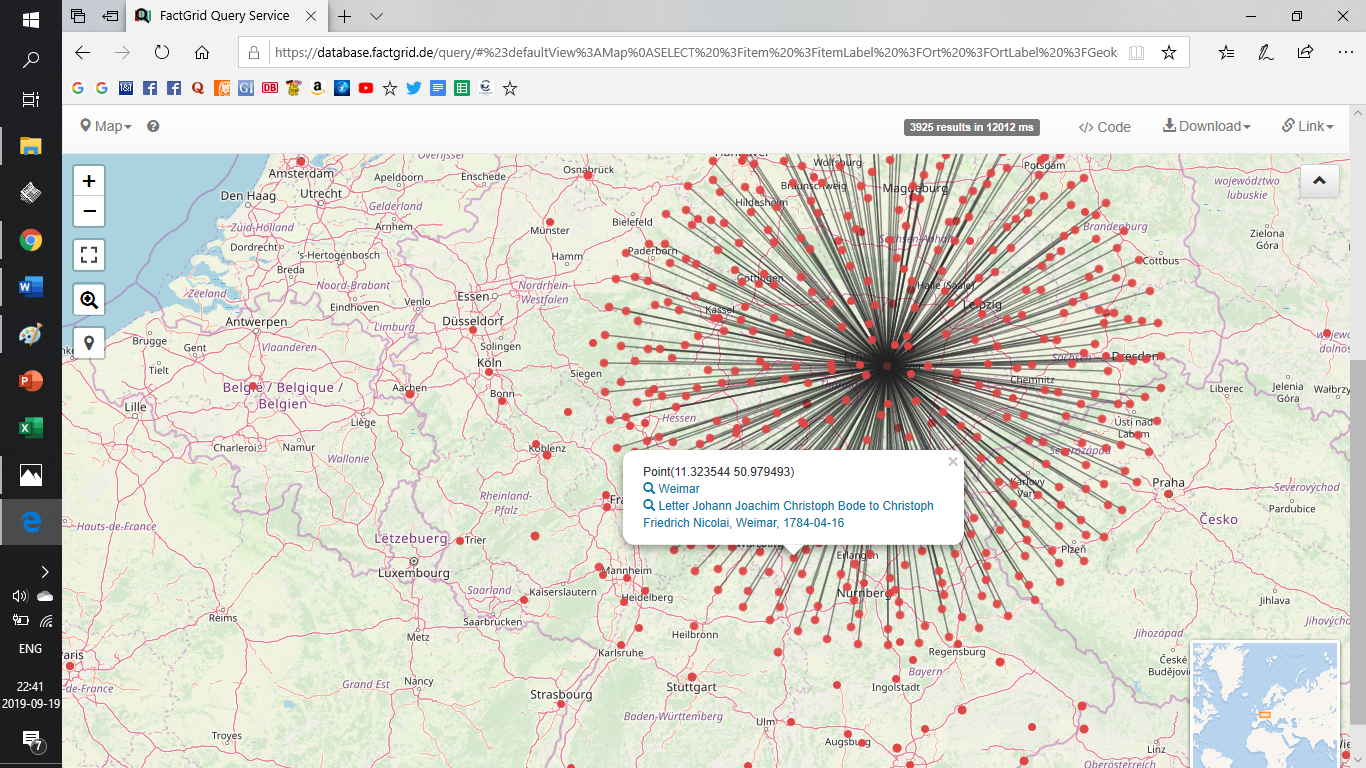
Bode’s Weimar correspondence – a nice representation of the number of documents but not much more.

Letters – that is the charm of the more refined temporospatial visualisation – tend to come in correspondences and these evolve, they stretch out, they blossom, and they die eventually.

The Illuminati are an almost ideal object for this particular visualisation as they present a full case to study. The “Republic of Letters” had remained out of reach for the Stanford project. The thing which we today prefer to call “academia” or “scientific community” was far bigger than the carefully selected and spectacular cases that created the first visualisations in 2009 — and only the whole picture would have revealed the evolution of our present academic debates between the 1480s and 1800. Regions and emerging nations brought forth increasingly scattered cultures of learning and they invented modern national topics such as our present debate of (usually national) literature. The spectacular exchanges could not possibly reveal these developments.

The Illuminati correspondence is, admittedly, no longer complete. We are looking here basically at the archives of Weishaupt and Bode and the Bavarian publications of 1787 – but it is even in this selection a clearly and well defined object. You know when you have an Illuminati letter in front of you: The author uses code names and the (messy) Illuminati-Persian calendar. The Organisation created complete genres of letters such as the monthly “Quibus Licet” which every member had to hand in and which would be answered with a “Reproche” signed by “Basilius” two months later. The genres are as remarkable as the internal affairs discussed in these letters.

The Order itself was at the same moment basically a complex correspondence: an organisational construct that generated a particular and unstable flow of information. Paul’s time lapse encapsulates the history and the drama of the Illuminati: For about two years – from 1776 to 1778 – we see very little: Ingolstadt is the place where Weishaupt’s “Perfectibilists” could organise most of their affairs in face to face meetings.

The situation changed dramatically in 1778: The Illuminati opened a lodge in Munich and started to infiltrate the masonic world.

Again two years later, in 1780, we see Adolph Freiherr von Knigge rising with exchanges he is now maintaining from Frankfurt and then from Heidelberg.

Knigge wins Bode for the Order in September 1782 and Bode in turn resolves the escalating conflict between Knigge and Weishaupt in 1784 and 1785: Knigge is forced to withdraw but Weishaupt does not regain his former position as the head of the organisation. Bavaria exposes the Order in 1786/87 with the first two editions of intercepted Illuminati documents. Weishaupt flees to Regensburg and then to Gotha where he ends in personal ignominy while it remains Bode’s part to come to the conclusion that he would not reform the secret organisation which could no longer claim to be a secret society.

You can pinpoint the individual letter to see who was writing here to whom with what letter exactly

Paul’s abstract movie wants to be explored. You can define the time frame and push it manually through the timeline, and you can click at each line to see whose letter is creating it. We can now see the overall quantities and the processes, the organisation’s actual growth and collapse on the map.

Far from perfect

The visualisation is state of the art and yet not much more than a show case at the moment. It is neither created in ever fresh queries nor can you use the html-page without some coding for your own questions.

The message, however is clear: The interface one would love to have with this visualisation could be far more simple than the present SPARQL query service. One would design it to always explore “correspondences” (P122Q11243) and one would ask the user for simple P—Q specifications of his or her desired visualistion. In the Illuminati case this would be:

  • Research Interest (P97) — Illuminati (Q10677)

One might just as well ask for “author” and name a couple of authors, or for recipients, but the Interface would do the rest and run the SPARQL query of correspondences to generate a list of the letters in question with senders’ and receivers’ places and dates.

Paul’s message is that this can be done: The centre of his html file is basically a SPARQL-search from our database. Maybe someone will script the interface during the Wikidata.con next month in Berlin.

And one would love to have more…

  • Think of a visualisation that tracked the movements of people on maps and that captured the moments when people (could have) met.
  • Think of a visualisation of the dissemination of objects – like copies of a specific edition.
  • Think of the spread of an organisation like Freemasonry with its mother lodges and filial branches.
  • Imagine a visualisation that traced your ancestors with a look at genealogical data.

Wikibase instances should invite the production of interfaces that can do certain jobs without bothering the user with SPARQL or Java proficiency. The cool thing about Wikidata or FactGrid is that these instances develop their (more or less) static ways to organise core data. We get more data but we continue to make the same useful statements especially if we have visualisations asking for these statements to be made with certain P- and Q-numbers.

Nodegoat would not lose any its charm if we began to offer similar visualisations; it will remain the software for the vast majority of projects that prefer the exclusive environment on which they can run exclusive and definitive presentations of their data. Wikibase instances are already very different beasts: They invite projects that want an open and growing landscape of data, and these projects will show the far bigger need of standard visualisations (i.e. of visualisations that use existing data and existing data structures). Projects on FactGrid or Wikdata need interfaces that already speak SPARQL. Time then to look at the more complex visualisations that are already running in environments such as the Stanford Republic of Letters Project or the Cultures of Knowledge Project in Oxford. We should act as the coolest competitors in this field, gather inspiration with the aim to inspire in turn.
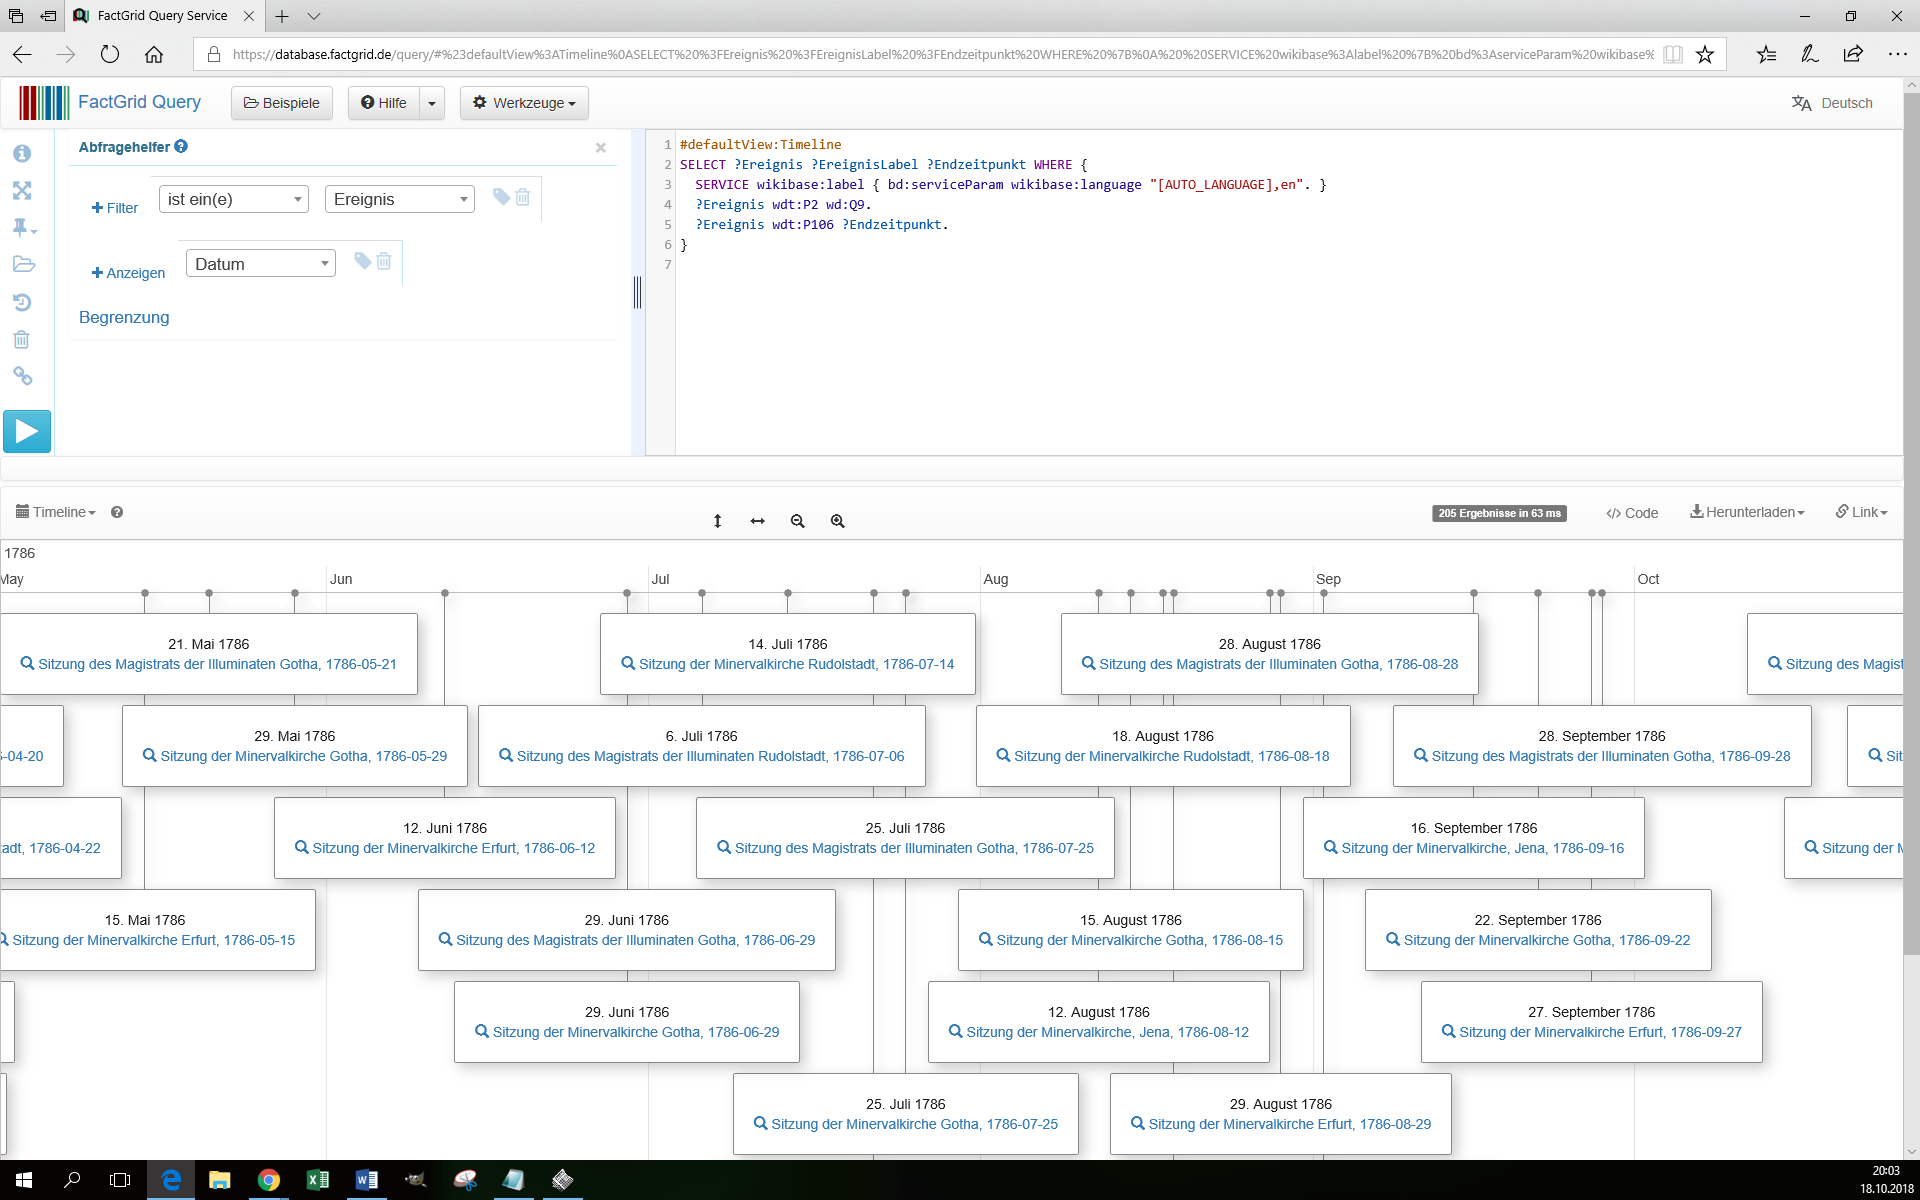
2018-11-16/17: Wikibase/Illuminatenorden Data-Mining Workshop: 10 Reisestipendien nach Gotha zu vergeben

[Google translation of this page]

Das Forschungszentrum Gotha veranstaltet jährlich einen „Illuminatenworkshop“ mit dem Ziel, aktuelle Forschung zum Geheimorden der 1770er und 1780er Jahre zu bündeln.

Nachdem wir dieses Jahr in einer Kooperation mit Wikimedia Deutschland gut 5.000 komplexere Sätze von Metadaten zu den Akten des Illuminatenordens in einer Wikibase-Instanz verfügbar machten, möchten wir mit diesem Aufruf Wikidata-Enthusiasten einladen, gemeinsam mit Forschenden einen ersten Blick in diesen Datenschatz hinein zu wagen.

  1. Welche Visualisierungen (Netzwerke, Timelines, geographischen Erfassungen…) lassen sich aus dem Datenmaterial ziehen?
  2. Wie müsste man die Daten strukturieren, um noch ganz andere Forschungsfragen anzugehen?
  3. Wie lässt sich das dieses Datenmaterial am besten mit Volltext-Transkripten von Dokumenten verknüpfen?
  4. Wie kann unser bisheriges konventionelles Wiki – die Gotha Illuminati-Research Base – aus der Datenbank Information beziehen?
  5. Wie modellieren wir Datenobjekte auf einem Kurs, der Informations-Redundanzen vermeidet?
  6. Wie würde man Daten eingeben, um Zeitschnitte (und Repräsentationen auf alten Landkarten) zu bewerkstelligen?
  7. Wie gelingt es uns, unsere Reasonator-Integration klug in Richtung eines mehrsprachigen, Übersichtlichkeit generierenden Informationsangebots zu nutzen?
  8. Wie machen wir unsere Arbeit optimal im Wikidata-Universum nutzbar?

Unser diesjähriger Workshop soll Datenanalyse und Forschung zusammenbringen. Mitspieler, die sich mit SPARQL Datenbankabfragen und Visualisierungen auskennen, wollen wir einladen, mit der Forschung ins Gespräch zu kommen. Wir haben die Daten, die Datenbank und detailliertes Wissen über die die Aktenlage des Illuminatenordens mit seinen gut 1350 Mitgliedern und Tausenden von internen Dokumenten, um das Data-Mining spannend machen –, aber erfassen im Moment kaum, welche Aufschlüsse uns unser eigenes Material in der ganz neuen technischen Erschließung gibt. Wir verfügen über Erfahrung mit unserem bisherigen Arbeitsinstrument, einem konventionellen Wiki, aber erfassen im Moment gerade in Ansätzen, was uns das komplexere Medium der Wikidata-Technologie an hinzukommenden Optionen der praktischen Arbeit liefert.

Wer am wissenschaftlichen Programm im ganzen Umfang teilnehmen will, kann am Freitag den 16. November 2018 ab 9:00 am Forschungszentrum Gotha in unsere Forschungsdiskussionen Einblick nehmen.

Der Data-Mining-Workshop, dem die vorliegende Einladung speziell gilt, wird am Nachmittag Forschende und Wikidata-Kenner zusammenbringen. Die Veranstaltungen werden im Verlauf des Nachmittags getrennt in einen Wikibase Bastel-Workshop und in die Serie der spezifischeren Fachreferate.

Ein gemeinsames Abendessen ist für 19:00 angesetzt. Das Forschungszentrum steht Bastelwütigen indes danach noch die ganze Nacht offen.

Am zweiten Workshop-Tag wollen wir gegen 11:00 die Gruppen wieder zusammenführen, um voneinander zu lernen:

  • Was können Forschende aus der Datenbank gewinnen?
  • Was wünschten sich Datenbankenthusiasten an Forschungsarbeit, um im Data-Mining wesentlich tiefer einsteigen zu können?
  • Wie würde man ein größeres Aktenerschließungsprojekt mit dieser Datenbank am besten organisieren?

Wir können Reisekosten (unter der sich entwickelnden Etatlage sicher aus dem deutschsprachigen Raum), Unterbringung und Tagegelder übernehmen. Teilnahmewünsche sind mit eingehenderen Aussagen zu Arbeitsinteressen bis zum 5. November 2018 zu richten an olaf.simons@piere-marteau.com.


Erste Suchen und Visualisierungen zur Anregung

Sample queries: https://database.factgrid.de/wiki/Sample_queries

Further Reading

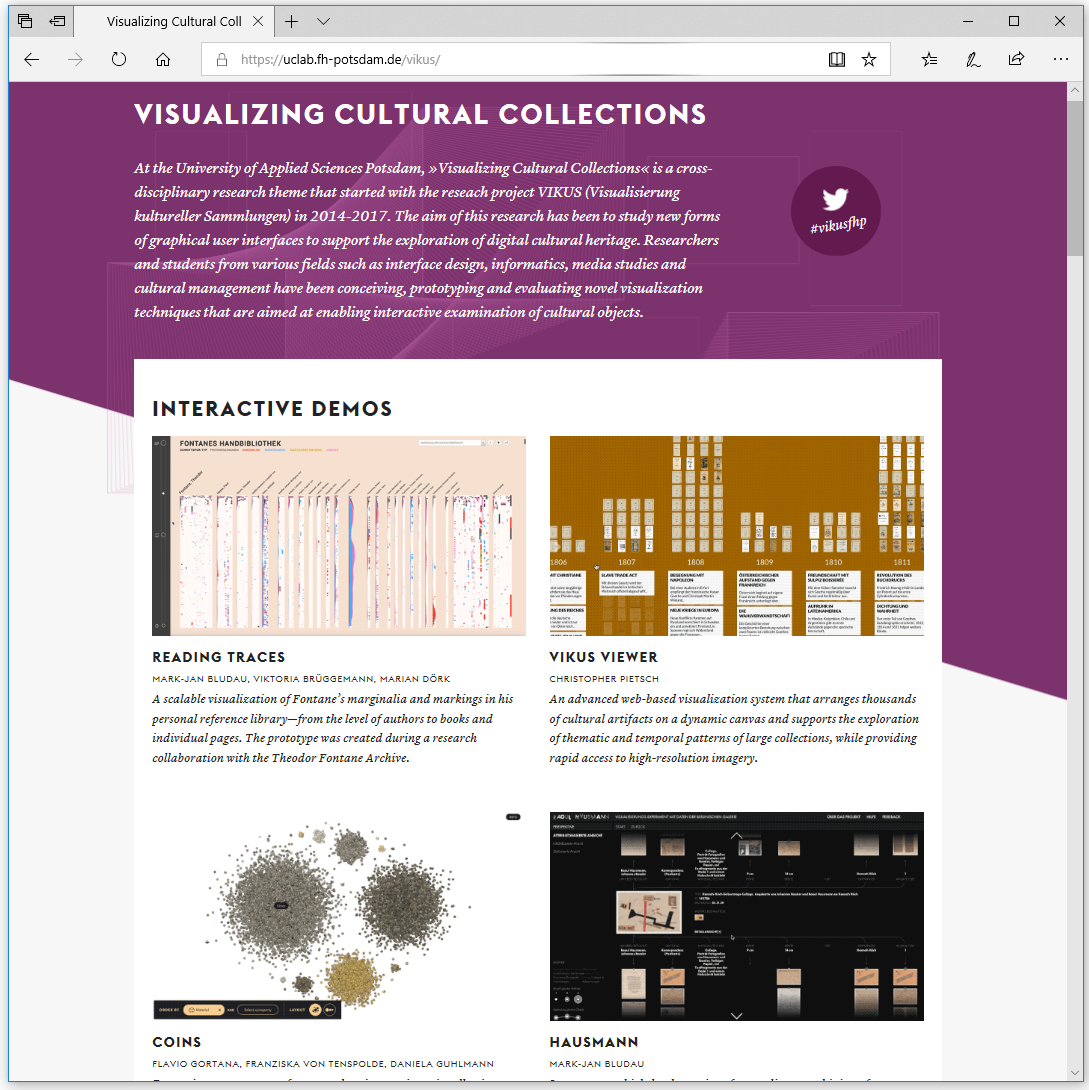
https://uclab.fh-potsdam.de/vikus/
VISUALIZING CULTURAL COLLECTIONS At the University of Applied Sciences Potsdam, »Visualizing Cultural Collections« is a cross-disciplinary research theme that started with the reseach project VIKUS (Visualisierung kultureller Sammlungen) in 2014-2017. The aim of this research has been to study new forms of graphical user interfaces to support the exploration of digital cultural heritage. Researchers and students from various fields such as interface design, informatics, media studies and cultural management have been conceiving, prototyping and evaluating novel visualization techniques that are aimed at enabling interactive examination of cultural objects.
more

As the last point makes it clear, the actual usefulness of the data comes with its use. Either in the form of services that are targeted at end users or by providing insights that are turned into stories that can be shared. To create a flourishing ecosystem of Wikidata-based applications running on high-quality data, a critical chicken-or-egg problem needs to be overcome: without complete and high-quality data, there are no cool apps. But without interesting apps, there are few incentives to provide data and to improve its quality. In other words: the main drivers of data quality and completeness are interesting and widely used applications, while the motivation to develop good apps is far greater if they can build upon a high-quality and complete data bases. In this article we will present a few of the things the Wikidata community is doing to address its chicken-or-egg problem.


  • Georgie, If you want to know more about how Academics are using Wikidata in Network Analysis research, here is our full Q+A with the University of Colorado. 2018-10-16 https://medium.com/

We started running SPARQL queries this summer. We are still experimenting with extracting data from the information we entered over the past year.

One example we tried was looking at House member ideology by occupation. Below shows the ideology of three occupations: athletes, farmers, and teachers (in all roughly 130 members).

The x-axis shows common ideology (liberal to conservative) and the y-axis shows member’s ideology on non-left/right issues such as civil rights and foreign policy. The graph shows that teachers split the ideological divide while farmers and athletes are more likely to be conservative.

House member ideology by occupation


Wikidata is the collaboratively curated knowledge graph of the Wikimedia Foundation (WMF), and the core project of Wikimedia’s data management strategy. A major challenge for bringing Wikidata to its full potential was to provide reliable and powerful services for data sharing and query, and the WMF has chosen to rely on semantic technologies for this purpose. A live SPARQL endpoint, regular RDF dumps, and linked data APIs are now forming the backbone of many uses of Wikidata. We describe this influential use case and its underlying infrastructure, analyse current usage, and share our lessons learned and future plans.

Image Source

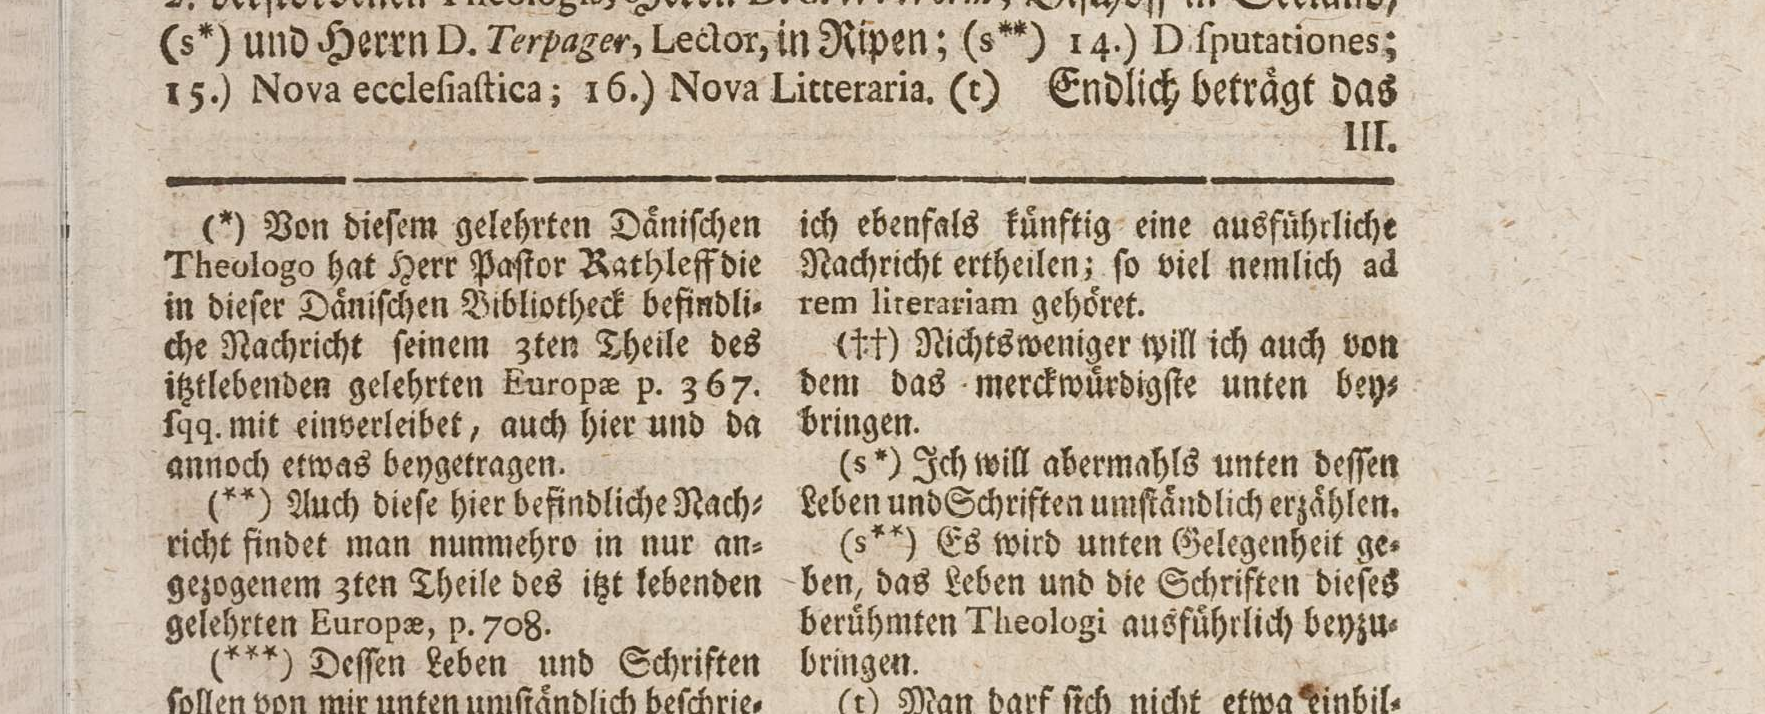
Arthur Kampf (1864 Aachen – 1950 Castrop-Rauxel), Der Zeitungsleser, Oil on Canvas. 70,5 x 60,5 cm (1908), from: https://www.lempertz.com

Needed thing #4: A module to state original claims (and published research)

The Problem

Original research means that we will (also) have to deal with statements that have not been published before. So far this is a huge problem for any researcher. Should she make a claim that was never made before – minutes after she found the archival record to substantiate the spectacular claim? You better wait until your book is out – which can take a couple of years, and if you still need a database to do your research you better work on a platform where your work is invisible until then.

The platform with immediate visibility of your work is at the same moment a massive advantage: If you publish the observation minutes after you made it, you will have made your claim and you can from now onwards refer to it. That, however, means that FactGrid claim has to be made publicly, visibly connected to your research, your name, with a specific URL that comes with a publication date.

The FactGrid must be able to turn any statement which is made on the database into a micro publication. You make the claim and you give the source with all the information about you including your evaluation and the details which any future research should continue to offer. The Wikibase Interface of our dreams should offer footnotes on each claim, every note nicely wrapped up for anyone to grab and to repeat in his own texts.

The more complex source attribution will have more advantages: It will allow researchers to fill the database with hypothetical statements. These will be marked as such and enter the test run, for you will now be able to see whether a hypothetical date (for instance) of a letter fuses into the data environment you are creating. You can immediately work with colleagues on a premise where you feared them as rivals who could steal your information.

Model solution

The FactGrid source attribution will have four sections. Users should be guided with drop down menus where possible. We generate a new Q-item to quote in the end:

Section 1: Published elsewhere or original research? (pull down menu plus input fields)

  1. This statement is already publicly circulating. (Input fields:) Q-number of the publication (plus field for more specific reference like a specific page number).
  2. This is original research to be credited as such. (Input fields:) Q-numbers of the researchers or team to be credited (plus date stamp and url to quote the entire module).

Section 2: the evidence

  1. Q-number(s) of the piece(s) of evidence (plus field(s) for detailed reference like page number(s)).

Section 4: evaluation (qualifier to the previous via pull down menu)

  • The claim can be taken for granted with the evidence given.
  • The claim is based on additional conclusions (stated in section 4).
  • No evidence given, yet the claim is generally accepted as fact
  • The claim is obsolete (for reasons discussed in section 4).
  • The claim is/was hypothetical (the assumptions are stated in section 4).
  • The claim is valid within the fictional universe.
  • The claim has a propaganda value.
  • The claim is part of a religious creed (see the discussion of section 4).
  • The claim is personal/family knowledge.

Section 4: discussion (link to the statement’s discussion page)

Use

The source statement will ideally contain all the information needed to (automatically) generate a footnote which can then be used by the Reasonator the FactGrid’s equivalent (see our needed thing #3), in any Wikipedia article or in any other publication referring to the claim.


Published also here: https://www.wikidata.org/wiki/Wikidata:FactGrid/Needed_thing_No._4:_A_module_to_state_original_claims_(and_published_research)

Needed thing #3: An attractive Interface for browsing and reading Wikibase information

The Wikibase software has been designed to serve underneath the +200 Wikipedia installations, it is offering its services in SPARQL-queries but it does not aim at people interested in the facts collected on an item of knowledge.

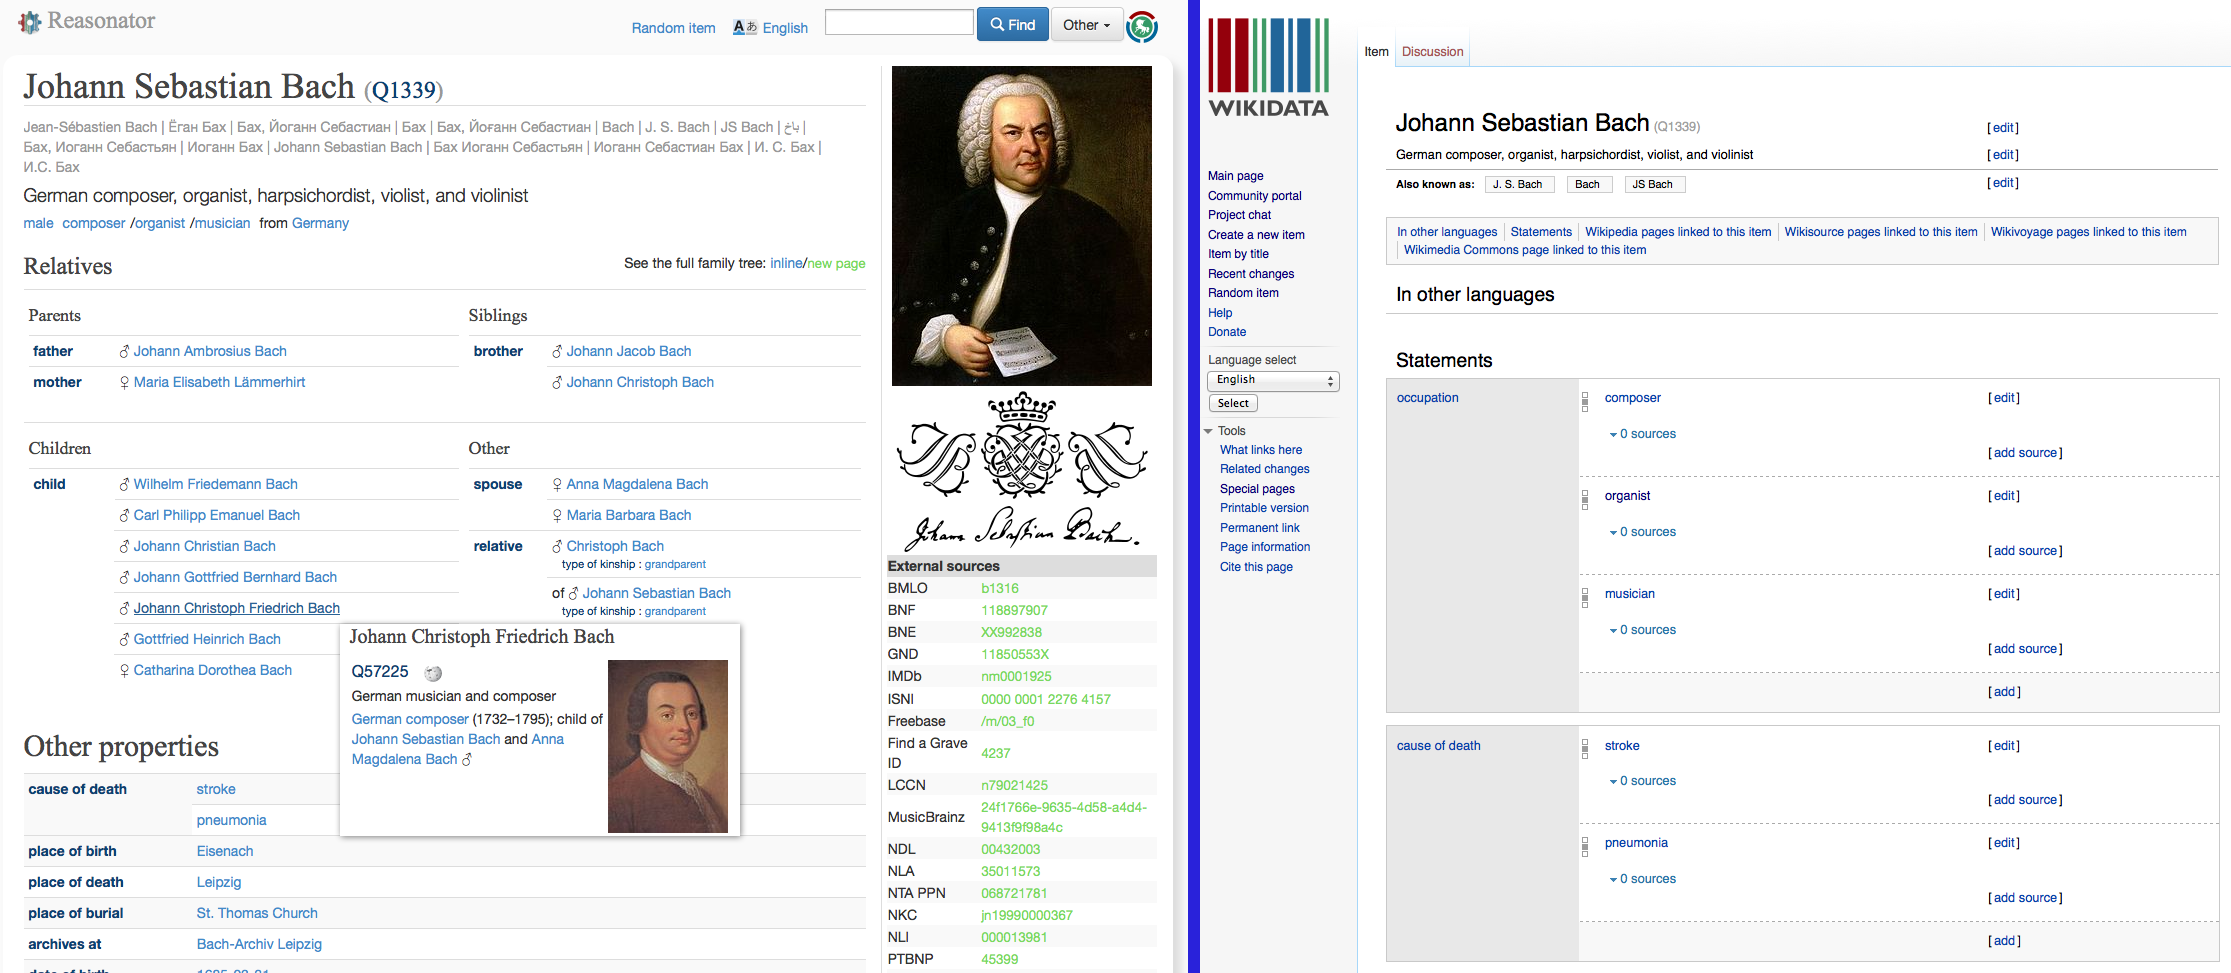
Magnus Manske’s Reasonator is the tool which turns Wikidata information almost into articles – in any language. The page on Q13339, Johann Sebastian Bach is, as it turns out, in many ways superior to the 200+ competing Wikipedia articles on Bach: It has one sinle source to be edited by users world wide. It shows at a single view what it has to offer – you do not crawl through well balanced sentences, which might not at all offer the information you are looking for.

But the Reasonator has its fundamental drawbacks: Technically you are on a platform that uses Wikidata information – not on the global Wikidata interface. Practically and organisation-wise you are on extraterritorial space when it comes to future developments. The Reasonator is Magnus Manske’s dream child. It is not part of the package Wikimedia will develop as the universal Wikidata front-end (because any such front-end would immediately rival the 200+ Wikipedias?)

The following thoughts aim at an “Interface” one would like to have with any Wikibase installation on whose and what technology whatsoever:

What the global “Wikibase Interface” should be able to do (and what it should avoid)

  1. Pages on items of knowledge (i.e. on Q-numbers of the installation) should not rival the written article (with automatically generated language statements).
  2. The interface should focus on the presentation of all the facts on a specific question. Get the first three entries of the list and get the complete list only if you click at more. Use the interface to get all the letters Leibniz has written, all the works composed by Bach, all the people Luther is known to have met plus dates and locations.
  3. An edit option leads from the specific statement on the Interface page to the specific Wikibase input section that is generating the statement.
  4. Users who are reading a biographical Interface page can press “edit via form” and they will be led to an input form for biographies with subsections to open. This is particularly useful on any page with fragmented and sparse information, since Interface readers will not necessarily have a clue what a Wikidata property is, and where to find it. They need inspiration of what questions they possibly could answer. See our Needed thing # 1: The technical solution that enables researchers to create input forms for the specific requirements.
  5. Any statement on the Interface page is referenced on page in a footnote (see Needed Thing #4: A module to state original claims (and published research)) so that users can grab the footnote and get it into the Wikipedia they are writing or into the research paper or book under their hands.
  6. The interface can present media and extended texts. A page on an archival document or 18th-century book must be able to offer the scans and a searchable text transcript (users who detect transcription mistakes must be able to correct the mistakes on the spot, through the interface). See one of our Illuminati-document pages for the requirement to be met.

Magnus Manske’s Reasonator is the Wikidata exploit that has taken the step into the data-driven alternative to Wikipedia articles. We should see the advantages: We leave the world of tediously constructed texts and all the confrontations these texts are bound to sparkle between want to be authors and offended readers. We get information that is actually generated in a global effort – where Wikipedia has been generating national communities so far with all their massive problems. We can aim at complete collections of facts. Do not press for “more” on a subject if you do not want to get the names of all the children Johann Sebastian Bach had – but use this source if that is what you want to know. We leave the debates of the various “notability” wars we are presently leading in or 200+ Wikipedias – the debates on what a respective “community” feels people should know, and what they feel one should not necessarily be bothered with.

We must reach the point where we see that Wikidata has actually merits of its own as a new additional source in the Wikimedia universe – and this is what Magnus Manske’s Reasonator has been doing almost in the shadow so far.

Links & More


Published also here: https://www.wikidata.org/wiki/Wikidata:FactGrid/Needed_thing_No._3:_An_attractive_Interface_for_browsing_and_reading_Wikibase_information

Needed thing #2: A logo and our own design

The facts all contribute only to setting the problem, not to its solution.
        Ludwig Wittgenstein, Tractatus Logico Philosophicus 6.4321

The FactGrid still needs its own cohesive design. The name is a modest allusion to Wittgenstein’s Tractatus and his idea that we see the world through a grid of factual statements. It was not that difficult to correlate this thought with images – looking backwards and a across cultural borders. The blog’s main page uses these changing images with humour and as inspiration.

That, however, is all we have at the moment – leaving a lot to be done. The different software platforms – our blog (WordPress), the Wikibase installation (Wikimedia design), and Magnus’ Manske’s Reasonator child do not really go together design-wise.

  • The project does not have a logo.
  • We are presently using Corbel on the FactGrid’s blog, a font with space to breathe, modern with its sans serif design and yet conservative with its medieval numerals and ligatures… is there an open source alternative? And: do we need to go open source with the font?
  • The database still has the Wikidata design (and basically the design of all the central Wikipedia projects). The blog is more in the direction to go. The database should, however, stay in close contact with its wikibase mother, so that anyone working primarily on the mother project can immediately feel right at home on our platform.
  • The FactGrid’s Reasonator interface should enjoy greater freedom to adopt a unified design since we are here mostly interested in an interface that represents information. We should here go for a design that is open to bigger representations of maps, images, models of objects, since our projects will be forced to produce show cases.

These remarks are will not yet serve as a specified task book, they should rather set a direction.


Published also here: https://www.wikidata.org/wiki/Wikidata:FactGrid/Needed_thing_No._2:_A_logo_and_our_own_design

Needed thing # 1: The technical solution that enables researchers to create input forms

Wikidata’s Wikibase installation has been filled almost entirely in massive automated data inputs. That is probably why input forms were not exactly the first priority.

Our database will focus on researchers and regular users whose tasks will call for modules which they can get used to. The historian might sit in an archive with the task to register some 200 documents of a law case. The documents have to be dated, information about authors, the institutions, and addressees has to given on each document. The private user might want to give biographical information about a distant family member with the aim to augment his family’s genealogy. Both are used to input forms. They will never have heard of “triples”, their ideas of “properties” will be inappropriate, they will not be able to use complex Excel-commands in order to prepare an input via QuickStatements.

Requirements

What we need is a technology which enables projects to create their own input forms:

  1. Research projects must be able to define and modify such input forms – using the properties they have created or found on the database.
  2. It should be possible to define and explain the particular input field – whether this field calls for an item (with a Q-number), a date or a numeric value etc. Predefined pull down menus will be particularly useful in a lot of cases.
  3. The ideal input form will give indications whether an item is already in the database by auto-completion and through suggestions.
  4. The tool should be able to create database items with new Q-numbers on a first input.
  5. It must be possible to return to a form and an item of interest once fresh information can be added so that bigger teams or a crowd can work in successive sessions on the same items. The Q-number could be the entry point.
  6. We should be able to nest forms, that is to include specific modularised forms in a bigger form: A biographical input will open with basic questions and it will then offer specific modules on the genealogy, places the person has lived and visited, education, degrees, memberships or works. A membership module for the Illuminati will differ from a membership module for the British House of Commons since being a member will raise altogether different questions in either case. The option of specific modules is necessary since we might get rare but complex options of interest to specialists only and since we should be able to duplicate entire modules: If a person is employed by different companies we get the same questions open again: From when to when? Which company? Where stationed? What position? What salary?

Use cases

Biographies will be the most interesting test field. Most users will have augmented their own CVs with biographical information more than once in their lives.

The document description will be the most interesting input form for historians to use – and a use case of its own practical value. We would test here the use of the database at the entry point where knowledge is produced with a tool that should be more handy than the usual individual word files which researchers are using for excerpts and random bits of information. The FactGrid document description could be used by archives in turn to gain the metadata users usually generate for their own purposes.

Status

Erfurt University funded a prototype development (see: https://database.factgrid.de/wiki/Web_Forms). We became able to generate input forms on the platform, smoothly using any properties a research team would gather on a specific module. It turned out to be more difficult to access such a form again at a later stage (as described in requirement 5 above).


Published also here: https://www.wikidata.org/wiki/Wikidata:FactGrid/Needed_thing_No._1:_The_technical_solution_that_enables_researchers_to_create_input_forms

SPARQL — the Query Language

Wikibase installations are – at this moment – best explored with the SPARQL query language. Specialists are able to write queries in SPARQL but this is not what you would do as a beginner. Most people take a look at an example of a query and then modify the example to suit heir needs.

Here just briefly for the beginning a couple of useful links.


Above: SPARQL in 11 minutes. Note: this video is not specifically on using the Wikibase software.

Above: Navino Evans, co-founder of Histropedia (http://www.histropedia.com/), demonstrating how to construct Wikidata Sparql Queries.

Useful First Aid Links

How to use QuickStatements to get data into the FactGrid

The video shows how easy it is to get data from regular spreadsheets via QuickStatements into the database.

You will find a handy cheat sheet of spreadsheet commands, to format your data here: https://docs.google.com/spreadsheets/d/1ov0BL_ob2rFhIl24G4BQhnVAdWeUYOAzlRphEgzOtAE/edit?usp=sharing

Our instance, https://database.factgrid.de/ hosted at the University of Erfurt has its own QuickStatements tool to manage the import of data: Access the tool under https://database.factgrid.de/quickstatements/.

If you do not have an account contact olaf.simons@pierre-marteau.com to get one.

Kopfzerbrechen Nr. 6: Dokumente des Illuminatenordens erfassen

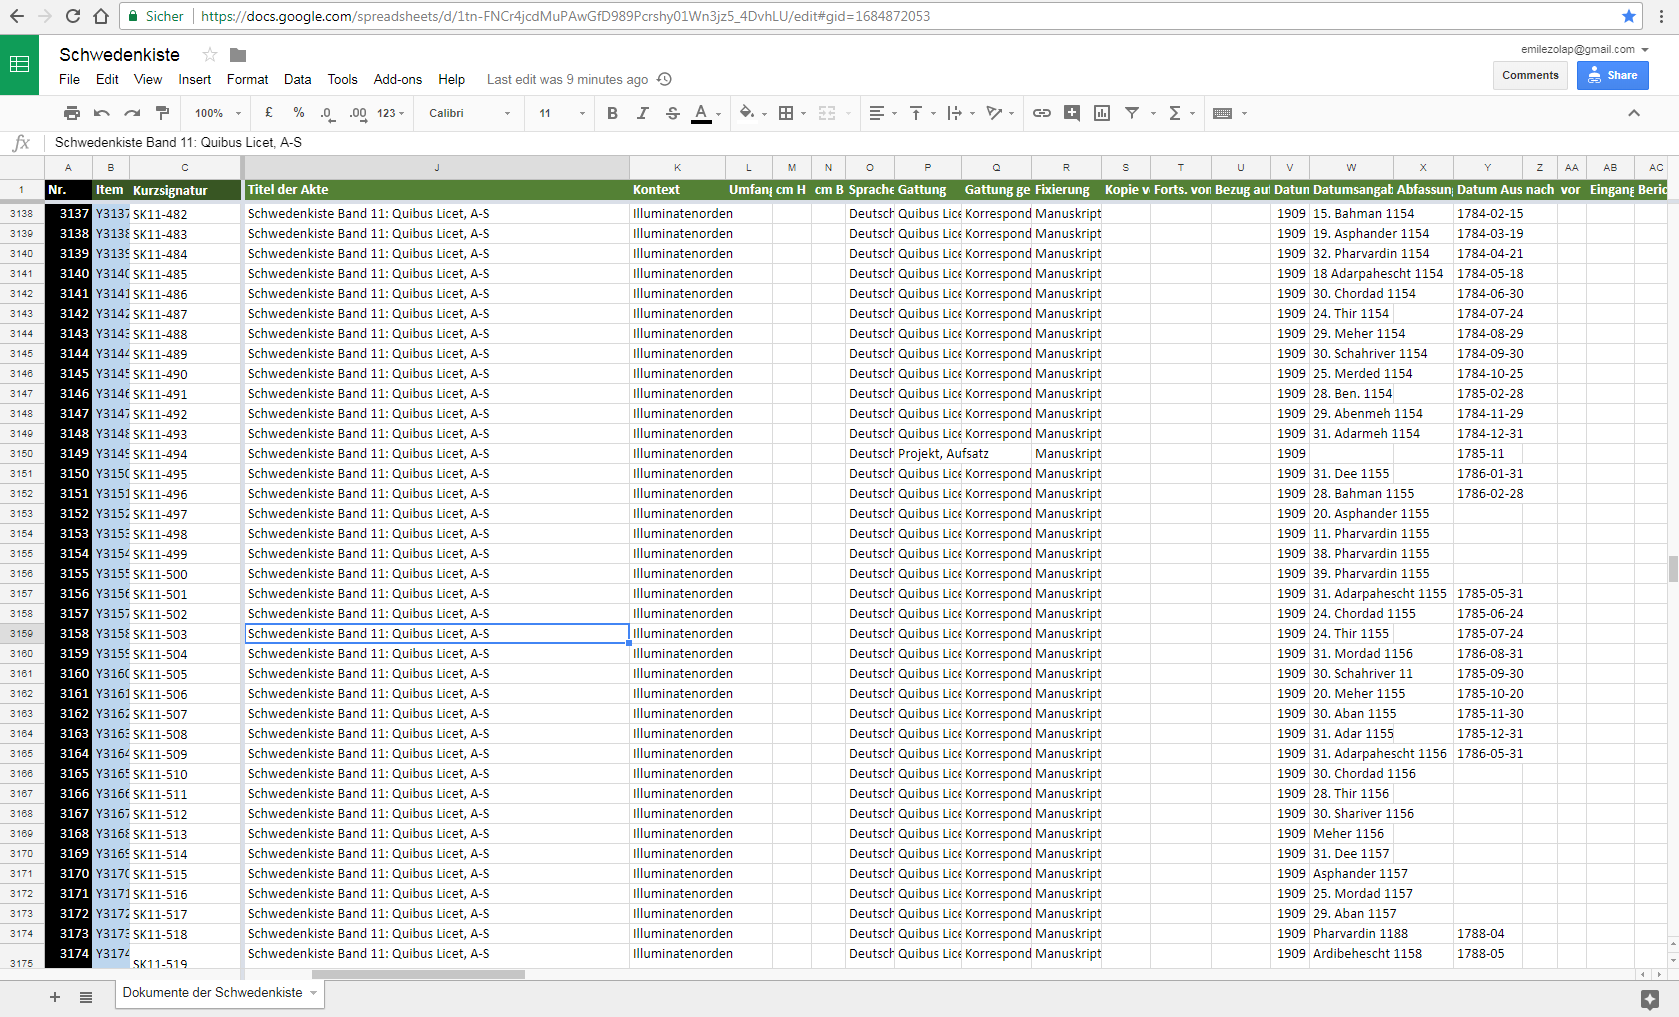
Im Verlauf unserer Arbeit legten wir zur Orientierung innerhalb der Schwedenkiste dieses Spreadsheet an. Jede Zeile (ab 24) ist ein Dokument innerhalb eines der 20 Bände der Schwedenkiste; dem folgen noch einige weitere Dokumente unserer Recherchen.

In der Visualsisierung der Datenbankinformation wird man später zu jedem Dokument eine Seite haben wollen mit Metadaten, Digitalisaten, Transkript, Übersetzung ins Englische.

Die Datenstruktur würde, von unserer Excelliste kommend, übersichtlich diese Felder haben, von denen einige unorthodox sind – der Orden verschlüssele Datums- und Ortsangaben, die Namen von Sendern und Empfängern wurden verschlüsselt, wichtiger noch: Sender schrieben regelmäßig an den Orden, ohne zu erfahren, wer dort ihre Briefe öffnete (das indes wissen wir, nachdem wir die Innenorganisation kennen).

Groberfassung

1. Kurztitel
2. Level: Archivbestand/ Akte/ Dokument/ Abschnitt in einem Dokument [ideal: Pulldownmenü zur Bestimmung der Erfassungsebene]
3. included in (in welchem Archivbestand findet sich die Akte, in welcher Akte das Dokument, in welchem Dokument der Abschnitt der hier erfasst wird?)

3a. dortige Position
3b. Seiten oder Blattangabe
4. Digitalisat online
5. Transkript online
6. Veröffentlichung

6a. Stellenangabe (Seiten von bis)
7. Übersetzung

7a. Stellenangabe (Seiten von bis)
7b. Sprache der notierten Übersetzung
8. Forschung

8a. Stellenangabe (Seiten von bis)

Objektbeschreibung

9. Umfang der Akte, des Dokuments, des Abschnitts (in der Regel eine Seiten- oder Blattzahl)
10. Format [unterschiedliche Angaben denkbar: 2°, 4°, 8°, DIN A…, cm x cm]
11. Manuskript/ Manuskript mit Noten/ Typoskript/ Druck/ Formular (mit Eintragungen)/ Schattenriss/ Zeichnung (mit Text)/ Konvolut
12. Handschrift
13. Sprache

Autor

14. Autor

14a Autor Selbstaussage (“Name vorenthalten, sprich anonym”, Initialen, Pseudonym…)
14b. Verantwortende Insitution
15. Absendeort

15a. Geo Kordinate
15b. Absendeort in seiner unklaren Nennung
16. Absendedatum / Enddatum der Komposition

16a Genauigkeit (ca./ recte/ fraglich)
16b Datierungsangabe laut Dokument
16c Abfassungsbeginn (z.B. bei Tagebüchern oder Briefen, die über Tage hinweg verfasst werden)
16d. terminus post quem (was ist das Datum, nach dem dieses Dokument verfasst sein muss)
16e. terminus ante quem (was ist das Datum vor dem dieses Dokument verfasst sein muss)

Empfänger

17. Empfänger

17a. abweichende Adressierung
17b. adressierte Institution
18. Ort Empfänger

18a. Geokoordinate
19. Eingangsdatum
20. Weitere Rezipienten (besonders wichtig bei den Illuminatenakten, wo man Briefe an den Orden adressiert, auf dass “Unbekannte Obere” sie lesen – die wir wiederum identifizieren können)

Inhalt

21. Textsorte standardisiert [hier muss Auswahl erstellt werden]
21. Textsorte Selbstaussage
22. Titel
23. Inhalt
24. Berichtsgegenstand [FactGrid-Id von Ereignis etwa bei Treffen, Konferenz etc.]

24a. Berichtszeitraum von
24b. Berichtszeitraum bis

Kontext

25. Antwort auf
26. Rezension von/ Gutachten zu
27. Fortsetzung von
28. Dokument ist [Auswahl:] Konzeptschrift zu/ Kopie von/ Reinschrift von/ Zusammenfassung von/ Übersetzung von/ Katalogeintrag zu

28a. Dokument zur vorigen Spalte
29. Bearbeiter/ Übersetzer (Information zur vorvorigen Spalte)
30. Querbezüge
31. Genannte Personen

Provenienzinformation nach Verlust des Objektes oder des Quellennachweises

32: Verlust/ zu recherchieren/ privat
33: Status seit wann
34: Grund (etwa Bombardierung des Archivs – Möglichkeit eines Ereignislinks)
35: Paralellüberlieferung (woher kommen die Informationen, die wir heute über das Dokument haben)

35a: Stellenangabe zu vorigem (Seite Default)

Provenienz bei vorliegendem Dokument

36. Besitzer / Archiv

36a. Geo-Koordinate
37. Besitz von/seit

37a. Besitz bis
38. Bestand
39. Signatur
40. Verzeichnis
41. Zugänglichkeit (öffentlich zugänglich/ eingeschränkt öffentlich zugänglich/ privat/ geheim)
42. Eigentümer
43. Wechsel gegenüber voriger Provenienz [Kauf/ Schenkung/ Leihgabe/ Enteignung/ Aneignung/ Raub]

FactGrid-interne Information

44. Erschließung (Namen derer, die die Erschließungsinformationen lieferten, mit Jahresangaben)
45. Forschungskontexte (hier können Forschungsprojekte Materialcorpora für ihre Recherchen generieren)
46. Template (für eine Darstellung etwa im Article Placeholder)
47. Digitalisat (wichtig, wo wir nicht-öffentliche Bilddateien von unseren Servern benennen)
48. Achtung! (Raum für Bearbeitungsnotizen)

Die zentrale Frage dieses Kopfzerbrechens ist: Wie stimmen wir diese Liste mit bereits bestehenden Wikidata-Feldern ab? Wie erstellen wir hierfür eine Eingabeschablone, die – etwa bei einer Crowd-Erschließung – die richtigen Fragen übersichtlich stellt?

Wie generieren wir aus den Daten im Verlauf ansprechende Seiten zu den Dokumenten, die deren Lektüre zu einer angenehmen Erfahrung macht? Mit welcher Gestaltung würde man Übersetzungen einspielen (die Übersetzung ins Englische ist das größte Desiderat des öffentlichen Austauschs über die Illuminaten). Magnus Manskes Reasonator machte gute Vorschläge was die Gestaltung von Seiten aus Wikidata anbetrifft.

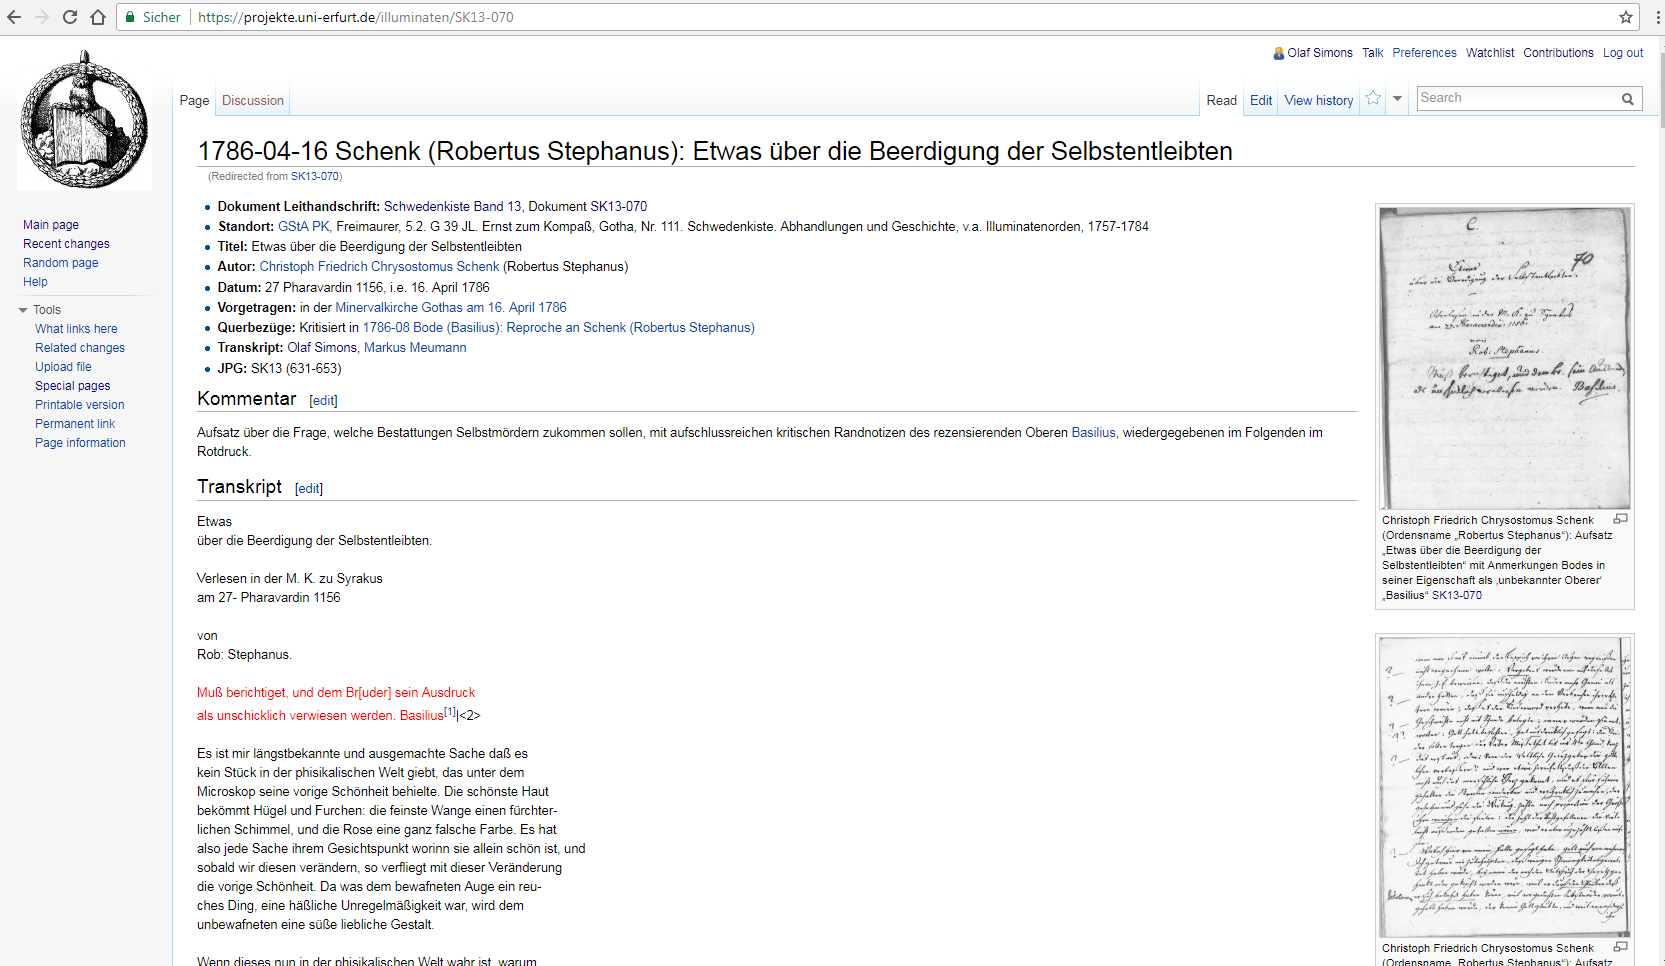
Bisher sehen unsere Seiten zu Dokumenten – unbefriedigend – so aus:

Screenshot SK13-070 https://projekte.uni-erfurt.de/illuminaten/SK13-070