Anfang des Jahres fragten wir (ich gab die Frage für Kathleen Schnabel und das Team Robert Gramsch-Stehfests ins Netz) die Welt der “Twitter Mediävisten” nach einem klugen Tipp, wie wir gut 3000 mittelalterliche Ortsnamen identifiziert bekämen. Es handelte sich um Ortsnennungen, die Studenten, die sich zwischen 1392 und 1450 an der Uni Erfurt einschrieben, zu ihren Namen in die Matrikellisten gaben, niedergeschrieben wohl immer nach Gehör.
Der Tweet war erstaunlich erfolgreich: 13.900 mal gesehen, 115 mal geliked, 100 mal weiterversandt. Hilfreiche Antworten kamen aus allen Richtungen.
Twitter Mediävisten: Wir versuchen gerade 3000 mittelalterliche (primär deutsche) Ortsnamen heutigen zuzuordnen. Hat jemand bereits einen solchen Datensatz, den wir nutzen könnten? #Ortsnamen#Mittelalter#Datensatz (Erfreut über weite Verbreitung des Tweets) pic.twitter.com/zj1zcTekmM
Natürlich hätten wir einfach bei den Immatrikulationen, die wir verzeichneten, in einem eigenen Feld notieren können, was die Studenten als ihre Herkunftsorte angaben, respektive die Schreiber daraus machten. Das taten wir auch am Ende. Wer aber von den Studenten eines Jahres aus demselben Ort stammte? Wo das Einzugsgebiet der Uni lag? Wie es sich mit dem Aufstieg der Uni veränderte? – das alles ließ sich ohne Identifikationen der Orte nicht klarer ermessen.
Banal war es, die Ortsangaben in einem Google Spreadsheet allen Orten der Datenbank gegenüberzustellen und mit VLOOKUP (SVERWEIS) eine unimittelbare Zuordnung durchzuführen. Die Treffermenge fiel aber unbefriedigend schmal aus und war durchzogen von sich auftuenden unterschiedlichen Problemen. Gotha konnte in den Matrikeln als Gota oder Gotta auftauchen, nur ein einziger Buchstabe verhinderte in diesen Fällen das “matching”. Bei Namen wie Akusgrann lagen die Dinge dagegen komplexer. Hier sollte man wissen, dass der Ort lateinische auch als Aquisgranum und Aquae Grani bekannt war und so zu Eindeutschungen verleitete.
Michael Markert von der Thüringer Landesbibliothek Jena schlug mit einem YouTube Tutorial den Abgleich vor, der das Feld der Treffer in dieser misslichen Lage unmittelbar handhabbarer machte – eine GND/Lobid Anfrage, die einen mathematischen Buchstabenaustauschverfahren Varianten ins Kalkül brachte, mit denen sich alle geringfügigen Schreibunterschiede erst einmal auflösten:
Skurrile Treffer machten die sehr speziellen Schwächen dieses Angebots deutlich: Argentinische Studenten wollten sich da 90 Jahre vor der europäischen Entdeckung Südamerikas in Erfurt eingeschrieben haben, Studenten „de Argentina“, aus Straßburg.
Ein eigenes Problem blieben zudem die Orte mit aktuellen Namensgleichheiten. Dem Abgleich fehlten Wahrscheinlichkeitsparameter, Formen eines eigenen Kontextes: Von zwei Rothenburgs sollte das bei Fulda eher im Einzugsbereich der Erfurter Universität liegen als das an der Tauber oder das an der Wümme (entscheiden ließ sich das letztendlich jedoch nicht). In anderen Fällen war eher über Infrastrukturen nachzudenken: Wenn es zu einer Nennung ein Dorf und einen Ort mit mittelalterlicher Lateinschule gab, war vermutlich eher der Ort mit der Lateinschule der Entsender.
Am Ende blieb nichts übrig, als in einer Gruppensitzung alle Vorschläge zu überprüfen und bei vielen der Angaben historisches Wissen spielen zu lassen – bei 3000 Ortsnennungen ein gerade noch gangbarer Weg.
Das Endergebnis blieb eine Annäherung und erweist sich im Moment als vorurteilsbehaftet: Österreich, die Schweiz, die Niederlande sowie die ehemals deutschsprachigen Ostgebiete dürften in der folgenden Karte unterrepräsentiert sein (man kann in das Iframe hineinzoomen, die Karte wird bei jeder Browserauffrischung frisch aus den Datenbankeinträgen generiert). Was hier sichtbar wird, ist, dass wir Orte nach heutiger Nationalität gebündelt in die verschiedenen Schritte des Abgleichs brachten, um dabei annäherungsweise räumliche Nähe ins Spiel zu bringen.
Erst Blicke in die Biographien werden die Entscheidungen substantiieren können. Die Datenbank erlaubt es indes, Baustellen aufzumachen. Dies ist die Liste aller Orte, die wir im Moment für eine “manuelle” Überprüfung zurücklegten:
Dem Bedarf, der sich hier auftat, Rechnung tragend, spiegelten wir die durchgeführten Identifikationen am Ende auf die heutigen Ortsnamen zurück, so dass sie sich nun zwei neue Handhabungen ergeben:
Gibt man im Suchschlitz des MediaWikis einen Namen ein, den man nicht sofort einem heutigen zuweisen kann, so erhält man mögliche Treffer unmittelbar über die Alias-Funktion der Wikibase-Instanz angezeigt.
Ortszuweisung nach den Aliasangaben über den einfachen Suchschlitz
Spannender aber sollte die Liste unserer Zuweisungen sein. Sie lässt sich nun unmittelbar aus dem folgenden Fensterausschnitt als CSV, TSV oder JSON-Datei herunterladen (die Download-Links erscheinen am rechten Fensterrand im Mouseover; Quellennachweise finden sich in den einzelnen Datensätzen und können mit einer komplexeren Suche auch hinzugeladen werden):
Als TSV Datei heruntergeladen lässt sich die nun spaltenweise erscheinende Liste jeder eigenen in einem Excel- oder Google-Datenblatt gegenüberstellen und mit VLOOKUP/SVERWEIS auf einfache Art innerhalb des Datenblatts abgleichen.
Weihnachten rückt näher. Wunderbar wäre ein Tool, mit dem man Abfragen kontextualisieren könnte. Wir suchten Orte aus dem Spätmittelalter mit einer Fokussierung auf Erfurt und einer Privilegierung von Orten, die im Mittelalter über Schulen verfügten. Nicht einfach. Die Macher des GOV, des Genealogischen Ortsverzeichnisses sollten hier viel weiter sein – vielleicht dass wir einmal zusammen einen viel intelligenteren Service zu Ortsnamen auf die Beine stellen.
The presently collected types of functional texts in German, English, French, and Spanish with Eckard Rolf’s bottom-line classifications https://tinyurl.com/27ctrfam
The links above give access to our first controlled vocabulary on FactGrid: “The FactGrid vocabulary of types of functional texts.”
Types of functional texts are not a matter of course. The corresponding genres of literary texts are, with all the problems discussed in the literary debate, far better known. The genres of functional texts are less controversial, but also less comprehensive. You find them in any mass of public records in the form of “insurance policies,” “interrogation protocols,” and “school reports,” to the odd “delousing certificate.” They do their jobs – so why collect the terms?
The technical answer is that Wikibase is software that invites you to use very specific vocabularies. You can run SPARQL queries on these specific terms and they will retrieve the “delousing certificate” in the mass of data, and you can, with very simple switches, bring far broader fields into view. The reduction to fields is the first step into statistics. If you can bring the variety under broader headings you can get a quick view of any vast production in your table. The vocabularies you need for this purpose have to be more than just lists of words. They need categorisations, common denominators above the words, ontologies.
A linguist’s perspective and data model
Our “Vocabulary of types of functional texts” has the required structural depth to allow statistical analysis and the broader analysis of larger bodies of texts. So far it is based primarily on the two Properties P894 “Eckard Rolf class of functional text types” and P912 “Speech act qualities.” The analysis is under both properties based on Eckard Rolf’s Die Funktionen der Gebrauchstextsorten (Berlin/ New York, 1993). Tobias Christ asked for the import of this vocabulary and its inherent structure for a project on functional texts of Germany’s Nazi era. He will explore handbooks for the organisers of Hitler Youth camps, official directives on the insignia of uniforms, etc. Rolf’s book is immensely practical with its in-depth analysis of 2055 terms arranged here in the five branches of illocutionary acts. Types of functional texts, under this premise, are essentially illocutionary speech acts as proposed by Austin and Searle in the 1950s and 1960 in their five branches:
assertives = speech acts that commit a speaker to the truth of the expressed proposition,
directives = speech acts that are to cause the hearer to take a particular action, e.g. requests, commands and advice,
commissives = speech acts that commit a speaker to some future action, e.g. promises and oaths,
expressives = speech acts that express on the speaker’s attitudes and emotions towards the proposition, e.g. congratulations, excuses and thanks
declarations = speech acts that change the reality in accord with the proposition of the declaration, e.g. baptisms, pronouncing someone guilty or pronouncing someone husband and wife
…thus the Wikipedia article illocutionary acts. Rolf deployed three further layers underneath this basic differentiation: two layers (of more or less specific) options on how the respective aims can be achieved and the fourth layer of situational conditions. The “delousing certificate” is under this matrix a “declarative statement” (a person is “declared” to be free of lice after the required treatment). The certificate will add a “personal dimension” to the bearer of the certificate – he or she will be free again to interact with others with the legitimation of the certificate. The statement is finally “body related.” Rolf created 100 groups under these four layers. The “delousing certificate” is in group “DECLA 12” together with the “allergy passport” or the “vaccination certificate.” Other types of texts do different things differently: A “doctoral thesis” (ASS 24) is an “assertive” – it commits the speaker to the truth of his or her exploration. The work is supposed to be “descriptive” and “argumentative.” The author will hand in this work with the “intention to gain a specific qualification.” Neighbouring types of texts such as the “book review” share some but not all features: Book reviews are again “assertives” and “descriptive” but without the author’s intention to gain a specific qualification with them. Their focus lies on a “judgment” they pass.
The following search gives the entire vocabulary in the four languages that are presently fully supported with Eckard Rolf’s primary classes and their basic categorisation:
Types of functional texts, generic terms in German, English, French, Spanish with Eckard Rolf’s bottom-line classification https://tinyurl.com/27ctrfam
The actual set of words is – especially on its German side – larger than the set of items. Rolf had separated terms like “Jagdschein” and “Jagdkarte” – in this case to have the German and the Austrian terms. In English both things are “hunting permits” unless we decide to offer individual hunting permits all around the world. In other cases the differences were stylistic, created by registers that could not be reproduced in English, French, or Spanish. We eventually reduced the set to objects of essentially the same meaning. About 200 words are now variants in the alias sections and on the P34 “naming” Property where they can attract explanations of their proper use.
Any of the nodes in the representation can determine a specific query of the terms at the end of the ensuing ramification. This is the complete list of speech act qualities searchable on the P912 Property of “Qualities of speech acts”:
It is just as easy to generate statistics on each structural level. Here is the visualisation of the top level in a bar chart:
The following four searches give the scripts for each level (the level difference is determined with the Q-Item in line 8):
The five illocutionary purposes of speech acts Q538467
Division by general way to achieve the purpose Q538468
Division by specific way to achieve the purpose Q538469
Division by primary conditions of speech acts Q538470
The searches above cover the entire terminological set so they can now be run on any specific body of texts.
The open tool
The FactGrid database version of Eckard Rolf’s structural analysis should turn the book’s considerations into an immensely practical tool ready to download into any other software environment and ready to be expanded on FactGrid. New types will not compromise the original set – it remains intact through the statement P124+Q514322 (“listed in Eckard Rolf, Die Funktionen der Gebrauchstextsorten”) that is made on every individual word:
The best way to add a new term is to find neighbouring terms and to adopt their statements. FactGrid already had a couple of candidates, such as the popular “Briefsteller” (the “letter writer’s guide”) of the German 18th century, or the “Quibus Licet” (the letter which Illuminati had to hand in every month to stay in contact with the “unknown superiors”).
Our first “controlled vocabulary” is with these preliminary remarks still very much of an experiment. —
It will be interesting to offer the generic terms also as “Lexemes”: — Wikibase Lexemes are special entities that organise individual words in their languages.
The French and Spanish labels in particular are still very artificial translations – we should have original terms for each of these items as referenced in historical documents.
The present vocabulary is not yet matched with external databases. Wikidata and the GND are the two most urgent data partners here. The following search gives the matching so far: https://tinyurl.com/284jbjhc
The linguist’s categorisation should be seen as one option to make sense of all these terms. One can easily think of other qualities of speech acts. In our preliminary talk Rolf proposed to explore, for instance, the assumed-sincerity dimension in many of these speech acts. “Lip service” was his example – a speech act where the “honesty of the emittent is unclear or doubtful.” One can just as well create completely independent properties on features of genres beyond the linguist’s interest.
We should eventually expand this work. A vocabulary of genres in all the arts and literature would be of interest here. One would balance such a vocabulary with a particular vocabulary of “historical generic terms.” (I remember, I once wrote a 700 page book with a plea to explore these terminologies in all their “deficiencies.” The deficiencies, so I proposed back then, were usually the first indications that people were not doing the things we are doing with works of “art” and “literature” in our debates. We might question our keenness on succinct definitions in these particular fields, so my thought ages ago; we do not really define words in order to settle debates, we are always far more interested in the destabilisation the definition will actually produce – but that is already a topic for a very different blog post.)
Published as part of the NFDI4Memory Task Area “Data Connectivity”, Historical Data Center Halle, project number 501609550.
FactGrid-Vokabular der Gebrauchstextsorten nach Eckard Rolf, Die Funktionen der Gebrauchstextsorten (Berlin/ New York, 1993), 2079 Items (Stand Juli 2023), alphabetisch sortiert, Download-Optionen am rechten Rand im Mouse-Over. https://tinyurl.com/22vslzt9
Mit den obigen und den folgenden Link-Angeboten lässt sich ein erstes „kontrolliertes Vokabular“ zu Gattungen von Gebrauchstexten aus dem FactGrid ziehen, sowohl als einfache Wortliste wie mit inhaltlichen Durchdringungen und Übersetzungen. Im Moment hat dieses Angebot noch experimentellen Charakter. Wikibase ist eine Software für Wissensgegenstände, nicht für Worte. Die Gegenstände erhalten Q-Nummern und auf diesen liegende Bezeichnungen in den verschiedensten Sprachen – Worte dagegen würde man in ihren Sprachen belassen wollen. Die Wikibase-Entwickler erweiterten darum 2018 ihr Angebot: Zu den Q-Nummern für die Dinge des Wissens kamen L-Nummern für „Lexeme“, die in ihren Sprachen verbleiben und nun Aussagen zu sprachlichen Bedeutungen auf sich ziehen.
Die Gebrauchstextsorten, die Eckard Rolf 1993 erfasste und sortierte, sind eindeutig Wissensgegenstände, die Angelegenheit für Q-Nummern: Eine „Mahnung“ ist eine Aufforderung, eine versäumte Zahlung nachzuholen – man kann diese Erklärung in verschiedenen Sprachen geben und die verschiedensten Sprachen haben ihre Worte für denselben Gegenstand: „dunning“ im Englischen, „mise en demeure“ im Französischen.
Der Anstoß zu diesem ersten kontrollierten FactGrid-Vokabular kam von Tobias Christ auf seiner Suche nach einem Werkzeug für die Erfassung von NS-Gebrauchstexten. Eckard Rolfs funktionale Klassifikation von Gebrauchstextsorten erfasst großzügig Begriffe und Kommunikationsstrukturen unter dem pragmatischen Gesichtspunkt des Handlungszwecks und erlaubt damit Blicke auf jeweils benachbarte Gegenstände – interessant etwa in Vergleichen der Gestaltung gleichartiger Texte. Statistiken von Produktionen lassen sich mit Rolfs Erfassung generieren, da sie das Gelände ohne große Doppelungen der Zuweisungen aufteilt. Der Autor stand bei der Datenbank-Version zur Seite, und ich vermute, er wird noch an einigen Stellen editorisch nachfassen. Mit dem nachfolgenden Link lässt sich die Liste in JSON, CSV, TSV oder Html-Tabellen herunterladen (rechts am Seitenrand eröffnen sich im Mouse-over die Optionen). Spalte 1 bietet die Links in die einzelnen Datenbankobjekte. Die Spalten 3 und 4 ordnen den Begriffen Rolfs Signaturensystem zu. Ich setze diesem die Einstufung nächster Ebene zur Seite, da mit ihr die Ordnungskriterien greifbarer werden:
https://tinyurl.com/22aznuh6 Gebrauchstexte, Gattungen, Basisklassifikation nach Eckard Rolf (1993) in der Ordnung der Signaturgruppen.
Eckart Rolfs Klassifikation der Gebrauchstextsorten umfasst originär 2056 Gattungsbegriffe, die auf oberster Ebene in fünf Gruppen auseinanderdividiert sind; die assertiven Gattungen bilden das Gros gefolgt von den direktiven, deklarativen, kommissiven und expressiven:
Statistische Aufschlüsselung der in Eckard Rolfs 1993 erfassten Gebrauchstextsorten in den fünf zentralen Klassen
Mit der EntiTree App lässt sich (durch Anklicken der Pfeile) das Gefüge entfalten:
Eckard Rolf bot diese Entfaltung bereits in seinem Buch an. Tobias Christ fasste sie in einer praktischen und um eigene Beispiele ergänzten Ansicht zusammen (Pdf), die mich die Knotenpunkte im System zuweisen ließ. Die spezifische Visualisierung wirft ein Schlaglicht auf die Art der Erschließung, die Rolf durchführte. Personalausweise mögen Personen Geschlecht, Augenfarbe, Körpergröße und Adressen zuschreiben – Eigenschaften, die einander gegenüber variabel bleiben. Eckard Rolfs Erschließung ist grundlegend anders: Die Eigenschaften untergliedern sich, sie werden feiner. Ich machte diese Verschachtelung der Optionen sichtbar, indem ich die Untergliederungen in den Aussagen auf allen ihren Ebenen mit erfasste. Auf der obersten Ebene ist die „Mahnung“ eine „direktive Textsorte“, auf der untersten eine „bei Zahlungspflicht auf Seiten des Rezipienten insistente bindende direktive Textsorte“.
Neben der Verortung im Gefüge eine Erfassung der Objekt-Eigenschaften
Die von Rolf angebotene Stammbaum-Untergliederung liegt auf einer einzigen Property, der Property P894: Eckard Rolf Gebrauchstextsorten-Klasse. Der Stammbaum mit seinen Differenzierungen eröffnet sich dabei von den Basisklassifikationen ausgehend; sie sind vom unten nach oben vernetzt. Mit der gewählten Property P894 lässt sich damit zwar das gesamte Gefüge wiedergeben und bei guter Skriptkenntnis beliebig gebündelt abfragen, im Umgang mit den einzelnen Begriffen bleibt das jedoch unbefriedigend. Die Aussagen zu jedem Begriff liegen jeweils in den unsichtbaren Knoten über ihm. Zwei Möglichkeiten bestehen, um die Aussagen einzeln zudem auch noch auf die Begriffsebene zu legen: Man kann für jede Ebene der Granularität eine eigene Property aufmachen, oder eine Summarische Sprechakt-Property aufmachen und auf dieser die Eigenschaften einzeln notieren. Ich spielte beide Lösungen durch und entschied mich im Verlauf mit nur einer Sammel-Property zu arbeiten – der Property P912: Sprechaktqualitäten. Es geht bei dieser Lösung nichts verloren, da wir auch auf den jeweiligen Aussagen vermerken können, auf welcher Betrachtungsebene sie gemacht sind und damit dieselben statistischen Auswertungen für jede Betrachtungsebene durchführen können. Die Sammlung der Eigenschaften unter der einen Property P912 ist vorteilhaft, da Nutzer nur bei Abfragen nicht vorab wissen müssen, auf welcher Ebene sich die jeweilige Eigenschaft bewegt. Man sucht nach Texten mit der Eigenschaft unter einer einzigen Property und erhält mehr oder weniger große Bündelungen.
Hier die statistischen Abfragen des gesamten Corpus, wie es Rolf erfasste, auf den einzelnen Eigenschaftsebenen:
Im beratenden Gespräch spielte Eckard Rolf die Antworten am Beispiel des „Lippenbekenntnisses“ durch, wobei er unversehens mit der „Erfülltheit der Aufrichtigkeitsbedingung des Sprechakts“ eine neue Ebene der Eigenschaften aufmachte, die in seinem Buch so nicht vorkam. Frage der Aufrichtigkeit ist interessant, da sie sich nicht im Stammbaum unterordnet und quer durch das Gefüge der Begriffe greift. Bei Textsorten wie der „Sonntagsrede“ sollte sie wieder aufkommen. Ich machte indes keine Begriffe auf und versuchte keine Zuordnung der P912-Property – Sprachwissenschaftler sollten hier nachdenken und eigene Begriffe und Erwägungen spielen lassen.
Die obigen Suchen sind gleichzeitig Musterabfragen, mit denen sich beliebige Corpora statistisch zergliedern lassen. Im Internet findet sich ein einzelner Anwendungsfall des Rolfschen Vokabulars mit der Statistik, die Stefan Rabanus in seiner Staatsexamens-Arbeit Die Sprache der Internet-Kommunikation, Mainz, Gardez! Verlag, Mai 1996 durchexerzierte. Hier ist besonders Node 37) nit der Auswertung interessant. Die FactGrid-Erfassung macht solche Auswertungen in Zukunft einfacher.
Genauso gut lassen sich unter der einheitlichen P912 Property nun einzelne Aussagen herausgreifen. Die folgende Mustersuche erfasst so etwa „bindende“ Textsorten. Wenn man unter dem i-Symbol den Query Helper öffnet, kann man diese Eigenschaft gegen jede andere aus der Liste aller Eigenschaften austauschen:
Die in Eckard Rolfs Publikation 1993 ursprünglich genannten 2056 Textsorten sind über die Quellenvermerke notiert und abfragbar. Das erlaubt es, neue Begriffe wie den „PodCast“ wie das „Quibus Licet“ (Q10508), das Illuminaten monatlich bei den Ordensoberen einreichen mussten in das Gefüge aufzunehmen ohne die Ursprungskonfiguration dabei unsichtbar werden zu lassen – man kann das größere FactGrid-Corpus abfragen wie Rolfs ursprüngliches. Aus der abgeschlossenen Buchpublikation von 1993 wird damit ein beliebig erweiterbares Gefüge.
In eine zweite Richtung musste das Projekt im FactGrid umgehend geöffnet werden: Die Datenbank ist auf Übersetzungen aller Termini angewiesen; englische Label sind dabei unabdingbar, um in den Sprachen, die noch nicht bedient werden. Die Übersetzungen sind im Moment noch sehr provisorisch.
https://tinyurl.com/2atg9fqy Liste aller Gebrauchstextsorten mit den Übersetzungen ins Englische, Französische und Spanische
Google scheiterte großflächig an den Nuancen der Rolfschen Liste. Bei 230 im Deutschen unterschiedlichen Begriffen kam es auf der englischen Seite zu Konvergenzen. „Rat“ und „Ratschlag“ wurden „Advice“; „Unglücksbotschaft“, „Unglücknachricht“ und „Schreckensnachricht“ wurden erst einmal nur „bad news“. Mitunter wissen wir im Deutschen, wann ein bestimmter Begriff angemessen ist: „Jagdkarte“ ist österreichisch, und „Jagdschein“ deutsch. „Schwur“ und „Eid“ überschneiden sich im Deutschen, doch zeigen „Amtseid“ und „Racheschwur“ Grenzen der Austauschbarkeit: der Schwur ist eher ein emphatisches Versprechen, der Eid formeller. Wenn eine andere Sprache nicht genauso differenziert – im Englischen gibt es nur den „oath“, ob als „oath of revenge“ oder als „oath of office“ – dann erhalten deren Nutzer zwei Items „oath“, zwischen denen sie sich nicht entscheiden können, nur weil auf deutscher Seite hier Unterschiedliches steht. In diesen Fällen ist es eigentlich ratsam, nur ein Item zu bespielen und auf diesem für jede Sprache ins Detail zu gehen und Worte zu listen, die dies meinen, samt qualifizierenden „Nutzungshinweisen“ auf der Property P598. Worte gehen bei solchen Zusammenlegungen nicht verloren, sie erhalten nur einen präziseren Platz als Optionen, die Sprachen unterschiedlich zur Verfügung stellen.
Was zu tun bleibt
Kontrollierte Vokabulare auf einer Wikibase-Instanz anzubieten, dürfte praktisch sein: In der Graph-Datenbank lassen sich Vokabulare im Plural verwalten und komplikationslos auf dieselben Begriffe legen. Wir können im selben Moment sagen, wie sich diese Vokabulare zueinander verhalten, wo sie deckungsgleich sind, wo sie eigene Vernetzungen auftun, und können so zwischen Vokabularen mühelos vermitteln. Man kann im selben Moment externe Datenbanken, die sich eines bestimmten Vokabulars bedienen, egal in welcher Sprache sie das tun, mit dem eigenen Lieblingsvokabular verstehen.
Das vorliegende Vokabular birgt im Moment als deutlich deutsches Produkt mit sehr feiner Nuancierung in der globalen Nutzung Desiderate:
Die Property-Label und Beschreibungen sollten noch einmal übersehen werden. Dies sind alle aktuell bestehenden Eigenschaften von Gebrauchstextsorten.
Die Übersetzungen müssen noch vollständig überprüft werden.
In der gesamten Begriffs-Liste sollten Zusammenziehungen auf „das jeweils Gemeinte“ erwogen werden. Verschiedene Worte für mehr oder minder dasselbe, legt man dabei zum einen auf die Alias Position (das geschieht beim “Merging” automatisch, danach landet man beim Eintippen der beliebigen Alternative auf dem zentral gesetzten Begriff), zum andern kann man die Varianten danach an Ort und Stelle mit „Nutzungshinweisen“ ausstatten. Es ist dies der Weg, der das Instrumentarium mehrsprachig eindeutig macht.
We are delighted to announce that PhiloBiblon, a database of the primary sources for the study of medieval Iberia, has received a two-year implementation grant from the Humanities Collections and Reference Resources program of the National Endowment for the Humanities to complete the mapping of PhiloBiblon from its almost forty-year-old relational database technology to the Wikibase technology that underlies Wikipedia, Wikidata, and FactGrid. The project will start on the first of July and, Dios mediante, will finish successfully by the end of June 2025.
The fundamental problem is to map the 422,000+ records of PhiloBiblon’s bibliographies with their complexly interrelated relational tables to the triplestore structure of Wikibase. A triplestore relates two Items by means of a Property. Thus a Work is linked to an Author by the Property “written by.”
We received an NEH Foundations grant for this project in 2021, as described in detail in PhiloBiblon: From Siloed Databases to Linked Open Data via Wikibase: Proof of Concept. Over the course of the last two years, the pilot project team, consisting of Charles Faulhaber (PI), Patricia García Sánchez Migallón and Almudena Izquierda (doctores por la UCM), Berkeley undergraduate Spanish and data science majors (Julieta Soto, Serena Bai, Tina Lin, Cassandra Calciano, Martín García Ángel), Max Ziff (data engineer), and Josep Formentí (user interface programmer), with the guidance of Olaf Simons, has analyzed the data structures of PhiloBiblon’s ten relational tables (using BETA for the test cases) and worked out the procedures needed to convert them into triplestore structures.
Almudena and Patricia manually mapped more than 125 BETA records to FactGrid: PhiloBiblon as models for the automated processing of the rest. See for example the records for Alfonso X, BNE MSS/10069 (Cantigas de Santa Maria), and the 1497 edition of the translation of Boccacio’s Fiammeta. These models have been key for establishing the semantic relations between PhiloBiblon’s data fields and the Properties and Items in FactGrid. In many cases appropriate properties did not exist and it was necessary to create them. For example, something as simple as the Watermark property was needed in order to identify the various watermark types set forth in PhiloBiblon’s controlled vocabulary.
Julieta Soto and Martín García Ángel attacked the problem of creating almost 900 FactGrid records for the controlled vocabulary terms in BETA. This meant in the first place a search in FactGrid to make sure that an equivalent term did not already exist, in order to avoid creating duplicate records. Then they had to situate the term in the FactGrid ontology by specifying it as a “basic object” (e.g., fruit) or identifying it as a subclass of an appropriate basic object, for example facsímil impreso as a subclass of facsímil. At the same time they had to link the record to the code in PhiloBiblon, BIBLIOGRAPHY*RELATED_BIBCLASS*FAP, identifying a record in the Bibliography table as a print facsimile, thereby making it possible to search for such items.
The default viewer used in FactGrid, the same as that used in Wikidata, is not user friendly. Therefore Josep has created a prototype user interface, using data from the BETA Institutions table. We encourage you to play with it and tell us what you like or—more usefully—don’t like.
This change to Wikibase technology is designed to allow PhiloBiblon not only to take advantage of the linked open data of the semantic web but also, and most importantly, to decrease sustainability costs. Because Wikibase is open-source software maintained by WikiMedia Deutschland, the software development arm of the Wikimedia Foundation, software maintenance costs for PhiloBiblon will be minimal in the future. This means that it will no longer be necessary to seek major grant support every five to seven years merely to keep up with technology change.
While this work has been going on, we have not neglected the vital process of cleaning up PhiloBiblon data in order to facilitate the automated mapping nor the equally vital process of adding new information to PhiloBiblon. For example, Pedro Pinto, a member of the BITAGAP team, has recently discovered a “folha desmembrada” (BITAGAP manid 7862) from the Livro 4 of the chancery records of king Fernando I (1345-1383) (BITAGAP manid 3255), separated from the manuscript in the Arquivo Nacional da Torre do Tombo. The newly discovered dismembered leaf contains five previously unkown royal documents. It was being used as the cover of the “Livro de Acordãos, 1620-24,” in the archive of the Santa Casa de Misericórdia in Coruche, a small city in the Santarem district on the Tagus river northeast of Lisbon.
The recycling of parchment leaves from discarded medieval manuscripts, presumably for more socially beneficial purposes, such as the protection of administrative records, was common in both Spain and Portugal in the sixteenth and seventeenh centuries. Such leaves have been the source of many previously unrecorded medieval texts. Perhaps the most spectacular exemple was Harvey Sharrer’s discovery in 1990 of the eponymous Pergaminho Sharrer (BITAGAP manid 1817), with seven unknown poems of king Dinis of Portugal (1279-1325). This had been used as the binding of a collection of notarial documents (Lisboa: Arquivo Nacional da Torre do Tombo: Lisboa, Cartório Notarial de. N. 7-A, Caixa 1, Maça 1, livro 3).
Friday week before last, we received the news that so many working groups had been eagerly awaiting: the 4Memory consortium (of historical studies) will become part of the Nationale Forschungsdateninfrastruktur (NFDI), the German National Research Data infrastructure.
This is exciting news for FactGrid, just weeks before its fifth birthday. We will be acting as an official repository for historical data in the upcoming NFDI structure. German projects can now make a good case that FactGrid is the optimal platform for their data.
NFDI4Memory task areas
Changing the rules of our present research data management
The German National Research Data Infrastructure aims to bring transparency and sustainability to all research fields, from microbiology to computational linguistics. Whether researchers are still collecting data entirely for themselves in private Word documents and Excel spreadsheets, or whether they are working on digital platforms that are more or less designed like conventional books, designed to be read and looked at – they will face new questions in their research grant applications: Do they produce data? Do they correct publicly available data? If so, the new questions will be: How do they make sure that others can actually work with their data? The idea that new information ends in footnotes of books and articles will not convince the funding institutions any longer. A CSV or JSON data file located on a library server will not do either. Linked Open Data is the only data that is easily reusable – that is what Wikidata has made clear. New platforms are therefore needed – platforms approved by the National Research Data Infrastructure.
The DFG that pushed the process has acted wisely. The different research disciplines had to determine how they would respond to its call for action. They had to create or join umbrella organisations in order to submit proposals for further funding. NFDI4Culture was one of the first groups in the German humanities to receive funding; Text+, for all textual studies, was also among the first arrivals, in 2021. The historical studies collective founded the 4Memory consortium and received the green light in the second round on Friday 4th. Funding will start in March 2023. The Gotha Research Center the 4Memory “participant” on behalf of the FactGrid community in this process.
An international resource as part of a national infrastructure?
It took us a while to feel comfortable with the invitation to participate in this process – back in 2020. At that time we had created a little more than 100,000 items with a handful of participants. Wikimedia Germany was our natural partner. The German National Library was the first major player to collaborate with us in a joint exploration of the Wikibase software. FactGrid from the beginning had invited international collaboration, with projects from France, the United States, Spain, Hungary, and Switzerland. Could we risk a nationalisation of the platform?
The project partners on FactGrid were open to the idea: It would benefit everyone to take the step. The process would open doors to important discussions. We could discuss data standards used worldwide and be able to think of international alliances on this new stage.
Our asset? – Wikibase
Following the NFDI debates,we soon understood why we had been asked to join: We were using Wikibase, the software platform that all members of the nascent consortia were discussing behind the scenes as the very software that could build the bridges between the working groups.
Wikibase invites cooperation. Its data modelling is uniquely flexible.
Versioning of all editing processes enjoys unprecedented transparency.
Wikidata demonstrates that seemingly incompatible fields of knowledge can be managed together in a single graph database.
Getting data from a Wikibase platform is as easy as it is to put data into it.
Wikibase instances can be federated – we can diversify the scenery without using one single Wikibase instance.
FactGrid was ahead of its time. We were running a functional Wikibase platform while other groups were simply proposing to evaluate the option.
And yet still at the beginning
Over the last two years we have more than quadrupled to 457,000 items. FactGrid is doubling almost every year and there is no reason to believe that this will change in the near future. Projects that are presently preparing data uploads are in the scope of the entire current platform; with our upcoming projects we remain on a global trajectory – we are becoming more international, the platform is learning new languages.
The NFDI process comes just in time because, despite all that growth, we are still right at the beginning, and in urgent need of technological development, which is where we put the focus in our 2020 and 2021 grant proposals. We are not alone in this situation. Wikidata, our elder sister, is still in its initial phase – a peculiar statement, given the fact that Wikidata is celebrating its 10th birthday these days with more than 100 million database objects.
Wikidata is massive. It has rocked the library world as a revolutionary development, but despite that it is still an unknown giant hiding somewhere behind the Wikipedia curtain. Nobody has ever spoken of the data-technical Pentecost miracle which Wikidata actually is. The very name of the project has remained hidden: “Wikidata – you mean Wikipedia, don’t you?”
It is understandable that Wikidata has remained a virtually unknown child. There is neither a search tool leading a wider public to Wikidata information nor is this information readable once you have reached it. The SPARQL query service is a nightmare for normal users. Even if you know how to read computer code– which most of us do not–, how do you find out what information the database can supply? Right, by asking your first specific question with knowledge of the content (the very knowledge that you still do not have). One day an internet-savvy user contacted us with the note that our Query Service had crashed. The Query Service seemed fine; I suggested a video call to get an idea of what the man was seeing on his screen – and it turned out that he was looking at the regular search script. “Send it off, press that blue button!” – He did and received the requested data set. “Ah, I had seen this code stuff but thought it was an error message…”
Wikibase needs two enhancements: An attractive search interface as simple as the Google search box (though with an additional advanced search engine and a SPARQL-search option on top) and browsing software that generates information from the Wikibase or, better still, from several combined Wikibases. The present Wikibase query engine leads you right to the item-pages in the default Wikibase presentation mode, where you can then manually correct or amplify information, but no one seriously enjoys the reading experience. Magnus Manske’s Reasonator, Markus Krötzsch’s SQID, Michael Ringgaard’s KnolBrowser, and Bruno Belhoste’s FactGrid Viewer have shown how Wikibase information can be presented: in pages that present their information concise, well structured, fast to access and easy to exploit. So far, however, all four browsers have remained patchwork solutions. They do not amalgamate platform information in greater depth, and (this is the larger issue) they are as yet not coupled to intelligent search engines. The problem is that we have not yet arrived at independent new resources, at resources whose pages are Google landing points, with pages that amalgamate information from various Wikibases such as Wikidata and FactGrid, and that keep their users on the platform – providing in depth information on request, generating visualisations on the spot, offering downloads of information which users have been accumulating on their tour.
We will get multilingual and attractive Wikibase aggregates. They will integrate information from various resources and they will offer this information in any language requested, identical across all the cultural and political divides. The German NFDI will have to create prototypes of such instruments if they should actually federate Wikibases in a new broader research oriented structure, even if that should start as a national structure.
Opportunities and risks
“The General Intelligence Machine.” Art by H. Lanos for “When the Sleeper Wakes” by H. G. Wells (1899), Wikimedia Commons
The time for a broader research data infrastructure is ripe. Researchers are still handling “their” data on personal hard discs; they copy and paste dates from Wikipedia pages when they could have complete data sets ready to download. Data correction remains fortuitous. Do you write an email to the producers of an online catalogue which you have been accessing with the request to correct a mistake? Do you give the correct date in a footnote of your next article and expect librarians (and Wikipedians) to take note of your work? – We need online resources that allow researchers to correct mistakes right on the screen, in real time; and these resources should be the same ones, which users employ to organise their research. Wikibase is the software that can help to make this possible. How will we get there? Wikibases will have to become the go-to scholarly resources to consult; that is when they will turn into the workbench for the very projects that are using their data.
The landscape of NFDI-consortia comes with its own internal risks. We will need resources to do highly specialised jobs: resources to store and mine texts, resources for the machine readable information which we need in order to make 3D reproductions of objects, and we need resources for historical statements. FactGrid is focusing on this latter need. It cannot become the all-in-one service for historical research. We need the services of other consortia and we should offer our particular services to the other consortia wherever they handle historical statements.
The much more delicate risk of fragmentation looms on the international stage: Will the German expert on French history find herself asked to store her data on a German platform since her funding is German – while her French colleagues with whom she shares the research objects will be delivering their data into a French database? We could, of course, harvest information from 150 national research data infrastructures but that will not provide the same experience for those who generate the information. Working on FactGrid you are about to notice when a colleague in France or China adds to your data. You will contact the colleague with a note of delight about the archival sources that had escaped your notice. Wikibases are joint platforms and should be used as such.
The question of a plurality of national research data infrastructures becomes even more thorny as soon as we look beyond the privileged horizon. We need global platforms to provide equal access to research and to the debates surrounding research. Wikimedia has created Wikidata with the explicit aim of having a software compound on which users from all over the world can work together – accessing and expanding the same pool of global information. We, the international scientific community, the heirs of the international respublica litteraria, shouldn’t fall behind the Wikimedia project.
The fact that FactGrid, an explicitly internationally oriented resource, has entered the NFDI4Memory structure is an interesting development – a chance to get more than one National Research Infrastructure on board.
Header image source: Robert Charles Dudley (British, 1826–1909) Interior of One of the Tanks on Board the Great Eastern: The [Transatlantic Cable] Cable Passing Out 1865/66, Watercolor over graphite with touches of gouache (bodycolor) https://www.metmuseum.org/art/collection/search/383834
Linked, open data and Knowledge Graphs show their full power when they are connected. In technical terms this is called federation. A query across multiple data sources is then a federated query.
For example, an item from FactGrid is linked to the corresponding item in Wikidata to retrieve complementary information. This way, there is no need for redundant data in two different data sources, which in case of doubt are not synchronized.
A very simple query shows the partners of Magnus Hirschfeld, a renowned sexologist in the 1920s, from Wikidata as well as DBpedia, a knowledge graph derived from Wikipedia. It shows: Both data sources have partners, but different ones and both are correct. Only a federated query gives the full picture. Unfortunately, we cannot join FactGrid data. Because as of now, Wikidata only allows a “selected number of other SPARQL endpoints” for this type of decentralized queries. If FactGrid wants to participate, we have to get in line. FactGrid has now done that, we have made a nomination for ourselves.
Theoretically, all we need are external identifiers, for example to Wikidata or Wikipedia articles or other data sets such as the GND. A lot of FactGrid items have this information stored anyway. Perfect conditions to become part of the distributed ecosystem.
How long does this process take? No idea.
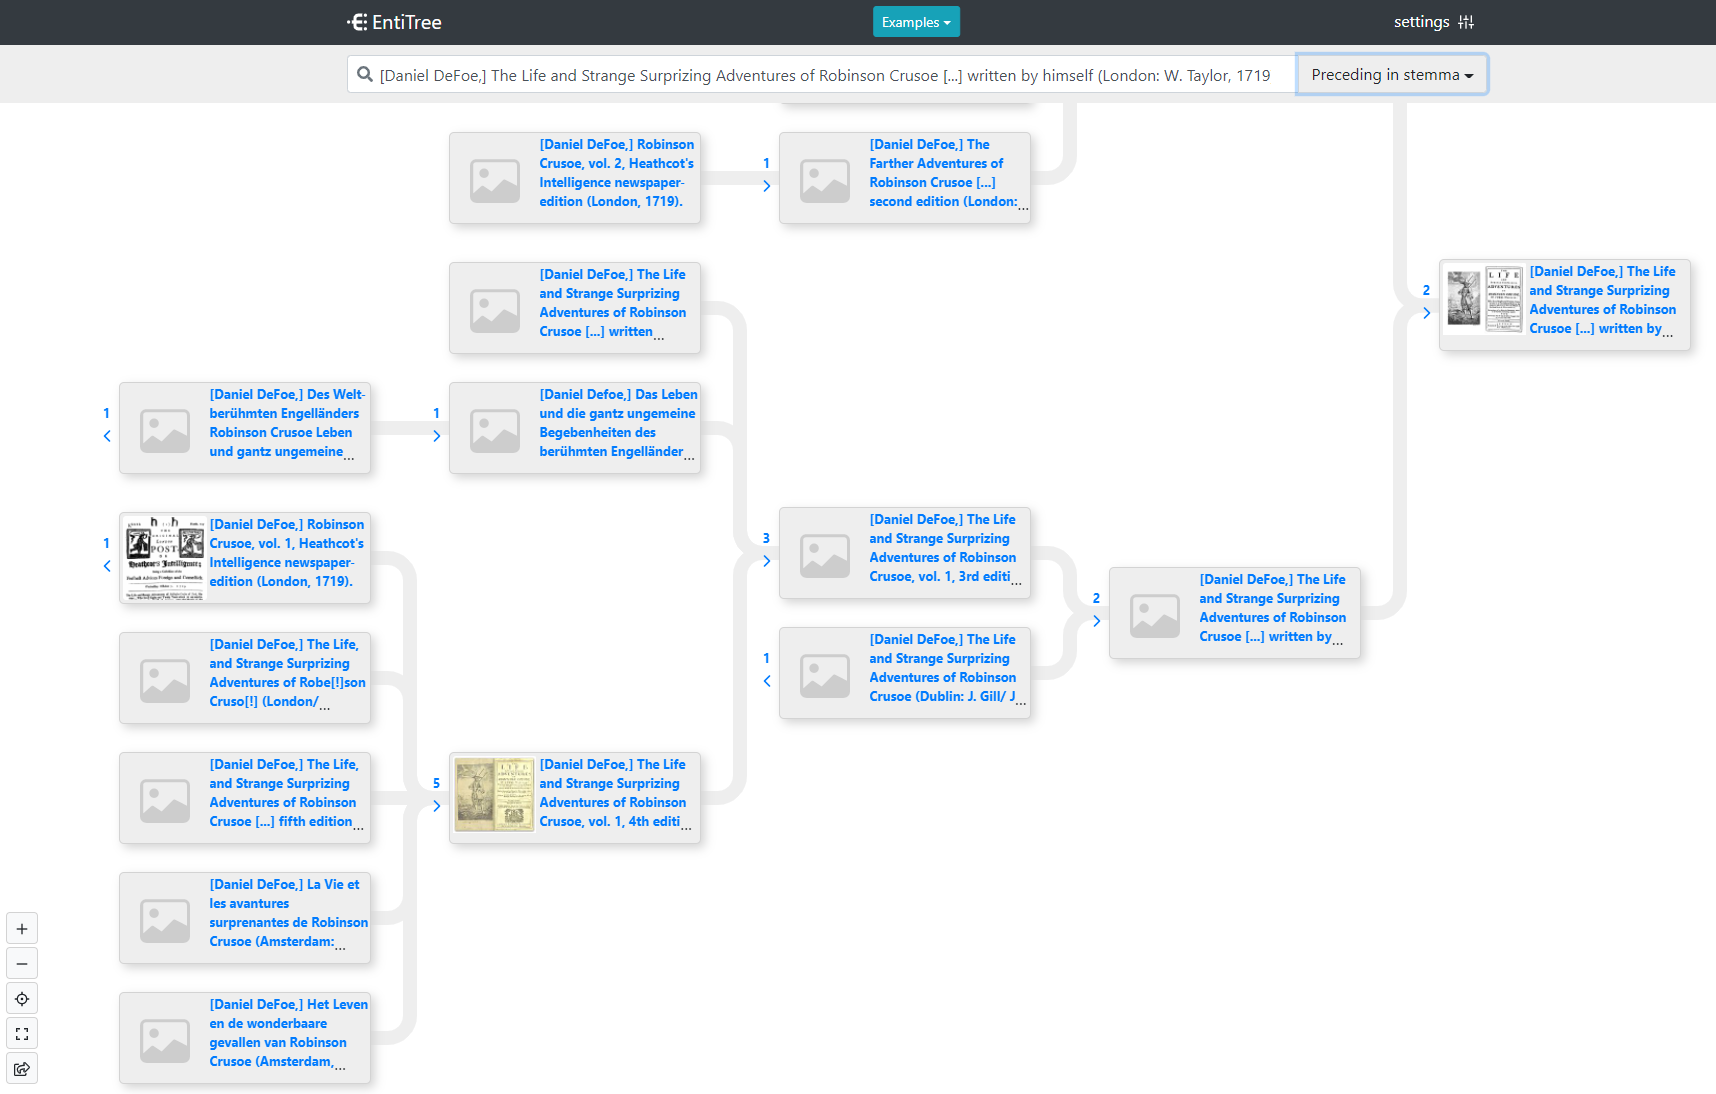
Michael Ringaard’s KnolBase, a prototype wikibase browser, gives a taste of the potentials. Based on the daily data dumps of FactGrid and Wikidata, KnolBase accumulates information from both sides. The Wikidata-Identifiers on FactGrid allow Ringaard’s browser to basically understand where the same has been said on both sides and where the information essentially differs. The result is no longer a side by side presentation of all the results from different pages but a new uniform page that intelligently presents all the information it has compiled – like a human reader would do after collecting and comparing the information of various sources. This is the KnolBase page on Adam Weishaupt and it is more than Wikidata or FactGrid offer on him:
A background to Wikidata federation and future plans is provided by Bayan Hills, who works at Wikimedia Germany, in her talk at the ld4 conference on linked data 2021, starting at 19:00:
Another good talk on querying on a decentralized web:
You are not looking at a sheet of cookies or ceramic tiles, these are a group of tablets from the Anatolian Civilizations Museum in Ankara, Turkey. They come from an ancient city called Kanesh, in Kültepe Turkey, in the region of Cappadocia, where more than 20k tablets have been recovered (so far) which date between 1930-1730 B.C. Each of these tablets record the names, places, and notable objects of a world once forgotten to history, but one that we can now restore and preserve through digital tools and methods. But before diving into the digital world of these objects, let’s talk briefly about why these objects are in need of protection and digital preservation.
Why build a multi-modal Linked Data Model for Cuneiform Languages?
There are numerous reasons why building a linked data model will be helpful to many different parties. First there’s the scholars (aka. Assyriologists and archaeologists) and their students, who are not many in number, but who have a keen interest in preserving the cuneiform data in order to better understand these ancient civilizations. Second, there’s the local communities who are living near or on top of this material culture, and while they may not fully know or appreciate the information these objects provide, they know it has a significant value. Third are the authorities who are concerned with world heritage preservation and have recognized these tablets as artifacts which are at risk of being illegally looted and traded on the black market, and who are in desperate need of assistance to identify such objects when they happen to be in transit. Fourth, are the museums and institutions which house these objects, sometimes with very little information about their provenance or original context. Fifth, are the computational specialists, whether in computer science and machine learning or computational linguistics and natural language processing or just interested engineers and programmers, who are often intrigued by the idea of these objects and their inscriptions in under-supported languages and see the opportunity for developing computational tools to support scholars in the decipherment and translation of these ancient languages. These individuals also play a significant role in the creation and maintenance of open source tools and frameworks to analyze the wealth of data that result from such computational workflows. Lastly, there’s the general public, who find these remnants of antiquity intriguing but are otherwise almost completely cut-off from the true knowledge and value which these cultures have provided scholars and may continue to provide to all of humanity. For these parties, and any others not in this list, the move toward a linked open data project will provide greater access to the whole of the cuneiform documentation, and allow the ongoing collaboration of these parties to take place in a secure, open source environment for all the world to discover.
What most people don’t know is that there are so many of these tablets. The estimated number (in Streck 2010) lies around a half-million. However, we currently only have digital records for about 350,000 cuneiform tablets, with metadata represented online in a number of databases (e.g. CDLI, ORACC, BDTNS). Perhaps only half of these have good 2D photos available online, and even fewer have digital text with transcriptions or translations accompanying their museum catalog data. That means there are still 150,000 which have been accounted for in some form, but are not yet available online in any open database. Some of these are no doubt “unpublished” tablets, which could be known to scholars and museums, but are kept from the public until a proper edition (transliteration and translation) can be provided in print. There’s an alarming number of tablets which have fallen into this category, and they are kept from open databases largely out of a lack of access to scholarly resources for text editions in their housing institutions.
To add to this challenge of digitization, it is important to keep in mind that such tablets are still coming out of the ground. Each season there are official excavations (and unofficial looting) taking place, and the results of these efforts are often objects and artifacts with inscriptions in cuneiform writing. They may be given to museums or end up on the market in some form, or they may never reach the public if they end up in the hands of private collectors.
Ancient Tablets as “Big Business”?
While the illicit excavation and looting of these ancient sites has been ongoing from as early as history can record, it has definitely become a form of “big business” in the region since the 90s, with rogue groups like ISIS hard at work trying to discover the ancient sites in their region, in order to loot any artifacts as a funding source. The site pictured in slide 6 with pot-marks like craters on the moon, is known as ancient Isin (Ishan Bahriyat), an important city-state already by the early second millennium BCE, and not far from where the Hobby Lobby Collection was most likely looted. The site is first known to us through a small number of archives dating to 1900 B.C.E. One such group of texts comes from the Šinkaššid Palace in Uruk about 45 miles southeast of Isin, and records a high degree of inter-regional trade and treaties among the existing and emerging city-states, which regularly manifested their cultural prowess and prestige through diplomatic gift-giving, thereby producing thousands of objects made of silver, gold, lapis lazuli, carnelian, and other precious materials. No doubt, for this reason, it is often the palace which is found looted when archaeologists are able to examine a looted site. If such documents are assumed to record inventories of the palace, then the conditions are ideal for a treasure hunt of epic proportion, especially when all around there is apparently nothing but desert for miles and miles.
All the the excavation sites where cuneiform artifacts have been found (embedded search to zoom in) QueryService
Evidence of the scale of such looting cn be seen from the ledgers of ISIS leaders, some of which emerged after the Abu Sayyaf Raid on May 15, 2015, which was “a raid by American special forces on an ISIS safe house in a small village outside Deir ez-Zor in Syria killed ISIS leader Fathi Ben Awn Ben Jildi Murad al-Tunisi, better known by his nickname Abu Sayyaf, freed an 18-year old Yazidi woman, and captured a trove of documents. Some of the documents captured during the raid were declassified several months later and have already been discussed in detail …, illustrating the inner workings of ISIS’ Diwan al-Rikaz or Department of Natural Resources. The documents showed that ISIS had systematized archaeological looting, with departments dedicated to the research, discovery and exploitation of new archaeological sites and a permit system to authorize diggers.” The recovered documents “showed that ISIS classified antiquities as a natural resource alongside oil and minerals, as something to be extracted from the ground rather than as looted items or spoils of war. Most important, the raid captured a receipt book detailing the khums tax levied on authorized antiquities diggers in ISIS’ Wilayah al-Kheir (largely coterminous with Syria’s Deir ez-Zor governate, with some territory in Iraq). The book contained eight receipts, of which showed that in the period from November 2014 to May 2015 Abu Sayyaf had collected $265,000 in taxes on looted antiquities, which multiplied by the 20% tax rate showed that the value of looted antiquities was around $1.25 million. However, these receipts were but a snapshot and could not show how much money ISIS had made in total from antiquities, or what percentage of their revenue was derived from antiquities looting.” (Jones 2016) It is clear to all specialists in this area that ISIS has taken the looting of cultural heritage to a new, more systematic level of destruction. Unfortunately, this type of looting has only escalated since the Gulf War in the 90s, which means that we continue to encounter looting happening on an industrial scale, often with evidence of large backhoe buckets having scooped the ancient remains of palaces, houses and neighborhoods out of the ground.
Among these looted sites was a Sumerian city, known as Drehem (ancient Puzriš-Dagan, featured in slide 7) which was initially looted in the 90s. Over time, the cuneiform tablets, bullae, cylinder seals, and other material from the site emerged on the antiquities market, and photographs were collected as they appeared on the internet. Fortunately, select scholars collected the photos and made transcriptions of the texts and published collections both in print and digitally in the online database of Neo-Sumerian texts (known as BDTNS). Thanks to the careful attention to details in the tablets, with very little archaeological context, these scholars have been able to assign about 15,000 texts to the provenance of Drehem in the cuneiform databases online.
Due to recent high-profile scandals, the general public may already be familiar with the present state of affairs involving the collections of artifacts from the ancient Near East. These images (in slide 8) were taken after the US Dept. of Homeland Security seized a large collection of artifacts procured illegally by the president of Hobby Lobby, Steve Green. (NPR reported May 2018: https://www.npr.org/sections/thetwo-way/2018/05/01/607582135/hobby-lobbys-smuggled-artifacts-will-be-returned-to-iraq)
The Department of Justice reported (July 2017) that: “The Oklahoma-based chain of retail stores bought more than 5,500 objects from dealers in the United Arab Emirates and Israel in 2010… The purchase was made months after the company was advised by an “expert on cultural property law” [who] had warned Hobby Lobby that artifacts from Iraq, including cuneiform tablets and cylinder seals, could be stolen from archaeological sites. The expert also told the company to search its collections for objects of Iraqi origin and make sure that those materials were properly identified.” This is no doubt referring to the collection that the Greens have been engaged in for many years now, for their personal Museum of the Bible. “But despite that warning Hobby Lobby arranged to purchase thousands of antiquities — including cuneiform tablets and bricks, clay bullae and cylinder seals — for $1.6 million. Some artifacts from the UAE bore shipping labels that falsely described them as “ceramic tiles” or “clay tiles (sample)” originating in Turkey. Other items were sent from Israel with a false declaration that they were from there.”
It is often the unspoken work of museum curators who take it upon themselves to provide important information to the leaders and authorities of such institutions, who then have the choice of pursuing an equitable path of repatriation. Thanks to open source databases like FactGrid, the methods for digital curation of these ancient artifacts can now be extended to an international audience (for more on digital curation, see Anderson 2022).
The knowledge of the historical precedent of these artifacts, coupled with an urgency for preserving cultural heritage at-risk, creates a strong impetus to enlist computational specialists in the effort of digital curation.
That said, cuneiform data is inherently multi-dimensional (e.g., slide 9), and therefore can be very challenging for the scholarly community to create accurate digital records. From the tablet measurements, to the signs impressed into the curved clay surface. There have been significant advancements made in the tech industry which can provide new avenues into these dimensions, including 3D scanned images of cuneiform tablets. A research team from Heidelberg and Mainz, Germany, directed by Hubert Mara, has developed software that will recognize the depth of each wedge indentation in the clay, and the wedge pairs that make up a sign. They have expressed interest in partnering with museums to digitize their collections, or share their tools for optical character recognition (OCR). (see Bartosz, Mara & Homburg)
3D technology has enabled anyone with a smartphone to make a digital replica of an object, which is ideal for working with cuneiform tablets. With writing on all 6 sides of each tablet, traditional photos often obscured the text transmission process. This new development in visualization has incredible potential for linking all forms of data in the production of a “digital twin”. Each artifact that contains writing has a wealth of relational data, which scholars can use to reconstruct the archaeological context for tablets and other objects with contemporary micro-stratigraphy, and this is true whether they are found in situ or come to us through looting and the antiquities markets.
There are also a number of implementations of network analysis in order to visualize the aggregated named entities of thousands of related tablets, along with linking linguistic features to the tablets with 2D and 3D image segmentation for machine learning and the development of machine translations. In the example illustrated in slide 17, there are three personal names written on a tablet which we can visualize in a network. This small group forms what demographers call a ‘cohort’ of related persons, and allows us to make certain assumptions regarding their temporal, and geographical proximity. We can then use these cohort groups, along with any other identifying data to merge instances of named entities on a series of tablets into a node representing a single entity. The primary challenge in such a process is the lack of any ‘gold standard test’, meaning that we can’t go and ask these people if they were, in fact, the ones mentioned on these groups of ancient documents. Therefore, scholarly collaboration and verification of the data is very important, but until recently this form of digital collaboration has been very difficult to pursue.
Linked Open Data has provided an attractive solution to both the need for securing data in a version-controlled platform (with Wikibase) as well as providing global access to the data with the highest standard that LOD can provide. This pragmatic focus on the usability of the data is very important for machine learning tools and methods to develop in support of these languages. It is unreasonable to expect such specialists to spend countless hours simply obtaining the data from the multiple databases that house the information for the same objects. By providing a hub where any and all aspects of these “digital twins” can be accessed and added upon, we will open up this cultural heritage for more holistic computational modelling and analysis with reproducibility and replicability from the start.
Because Wikidata employs both stable URIs through Linked Open Data (LOD) ontologies as well as git-based version control for any editor, it has become the gold standard database for the semantic web. These practices have enabled researchers to build projects which can easily be edited by collaborators around the world, and in any language. The FactGrid system allows for the use of an extensive list of data types and their relational properties, and perhaps more importantly, their framework allows for the creation of new properties and item types.
By taking the example of a cuneiform tablet, we can see (in slide 23) how Wikidata already possesses the numerous forms of data and metadata which scholars use to query and identify each tablet in space and time, and list the people, places, commodities and events inscribed on the document. Each of these entities can link to additional features in LOD triple statements, for example, a personal name can be linked to the family name, role, profession, and activity described with that entity, along with any other entities mentioned in a text. Each tablet can also be given statements for an accompanying seal inscription, along with the historical period (in its many formats), and any bibliographic data which may relate other scholarship (e.g., book and journal publications) to that particular tablet.
Using a graph database design, it is possible to provide persistent identifiers for both the data point and the relations between each data point (these two parameters for a triple statement). This makes each datapoint more discoverable in allowing for ‘fuzzy’ semantic searches, where one may not know what the exact location of their datapoint may be in a database, but they have enough contextual information to find what they are looking for. In this structure, data fall within multiple fields, or are linked to all possible fields (over time). To illustrate this, we could take a cuneiform tablet, which is a unique object. This object may have many different identifiers as it has been indexed in different databases over time. Anyone who wanted to learn more about that tablet would have to know where to go to find the data and metadata. In a relational database structure, one would have to use exact searches to find a certain tablet. In a graph database structure, using triple statements, the same tablet could be given a URI and that could then be linked to each database which has indexed it, along with any other information for that object using triple statements. These novel approaches work together to culminate in a new standard, referred to as Linked Open Data, which has been thoroughly described in Wikidata’s ontology (see also Wikipedia entry for Linked Data).
Stability and Versioning
Git-based repositories for code have proven to be the ‘best practice’ for releasing code in development, while still allowing for reproducibility. This is true because they automatically include version control, along with the dates and IDs of those who made the changes. These repos can be more inclusive and open, allowing for all contributors of a project to be documented on the repository by name. This is important not only for proper accreditation, but also for sustainability, since someone wishing to replicate the research may need to get in contact with someone on the team. Git-based open source repositories for software and code development e.g. GitHub, GitLab, Kaggle, have quickly become the academic standard for most scientific studies (i.e. those using code or reproducible methods). Websites like GitHub or GitLab, use version control to work collaboratively while building pipelines for work that is ongoing and iterative, but which also needs to be reproducible and replicable.
The flexibility of these new digital methods creates many opportunities and presents us with additional challenges, as they are currently in development and will likely continue to develop over the course of many years. The sense that a research project may never be “finished” should encourage project directors to use these more stable and reproducible methods when they design and apportion the development of a research project among their team. The CDLI (GSoC) is a good example of this type of workflow:
“At the CDLI, we are versioning text and now catalogue entries and we could extend this system to all entities, including named entities. We will definitely be versioning narrative entries concerning all words (including named entities) Older versions are not as accessible but other projects (eg. in classics) are leading in that avenue and I am looking up to them for improvement in the future.
When doing a study, it is important to provide a frozen version of the data and of the research processing code so other researchers can either try to replicate the results, or use a similar dataset to see the outcomes with the same method applied. At CDLI we provide daily dumps of all our data that can be linked to on Github and a monthly release with a DOI through Zenodo. A similar workflow can be applied with any dataset. Stability also comes from sustainability: it is important to think about long term archival of datasets.” (Émilie Pagé-Perron, personal correspondence)
With so many interested and invested parties, it’s difficult to find a one-size-fits-all solution to this multi-dimensional data, which is why a linked data solution is much more attractive. By using a Wikibase in FactGrid to store LOD triples, we can let scholars and museums continue to keep their records in the platforms they prefer, while still linking these data for greater accessibility and more holistic computational work. So our goal is not to constrain scholars to use an unknown platform, but rather to let them continue curating these objects in the catalogs they are currently using, and then to aggregate this data into a Wikibase, where anyone around the world can have access to these datasets with greater discoverability. In this way we work on building up the data pipelines and APIs for pushing and pulling these datasets between their existing websites into the FactGrid Cuneiform project (see slide 26), and when desired, we can even push the triple statement IDs back to these sites as well, in order to create greater transparency around the existing URIs.
Thanks to a tight social network, there are already many scholars who are eager to help in the process, so our project is well on its way. We began by laying the literal groundwork for this project thanks to a partnership with GLoW, CDLI and ORACC to begin with, who all provided the geographical data for the provenience of the tablets with geo-coordinates for over 600 known locations where cuneiform tablets have been discovered (see slides 13-14) . Subsequent discussions around the important features in prosopographical research have led to a series of helpful guidelines for our project (see Waerzeggers, et al. forthcoming).
Our next steps will be to add the relevant authority files from the catalog entries of the existing open databases for cuneiform, and then provide URIs for each tablet, along with the lines of text for each tablet, and the entities named on each tablet. From there we can get into the properties for the different entities mentioned on a tablet and their corresponding attributes, such as patronymics, professions, roles, activities, dossiers and archives. When there are dates recorded on the tablet, we will link those to a given ruler, as regnal years were the common form of dating throughout this time. Through this process we hope to have triples for each person, place, and thing mentioned on each tablet.
If you’re still wondering why go to all this trouble to provide labels for all the proper nouns, the impetus lies in a desire for a less ambiguous prosopography, which in turn will allow scholars and all parties involved to learn much more about the ancient world, as seen from the perspective of individuals over the course of their lives, along with their geographical movements and the social impact on the existing markets of the day.
Lastly, we are also motivated by the hope of what could happen when we open this data up to the wider scientific community. Recently we’ve seen the latest methods used by archaeologists and engineers in image technology, such as XRF and CT scanning, which can provide new insights into the composition and elemental characteristics of these objects. There will no doubt be many more tools and methods to come as science continues to provide access in “see-through” technologies. There is certainly great pioneering potential for new discoveries to occur, which is why it is so important to lay the groundwork for keeping all these different data linked together with the highest standard of data available, Linked Open Data. Thanks to FactGrid this will be made possible.
FactGrid is a wonderful, free and collaborative resource that the Gotha Research Center of the University of Erfurt in Germany has made available to the international historical community through the efforts of Olaf Simons. Many potential users are unfortunately put off by its apparent complexity. It is true that an initiation is necessary to exploit all its possibilities. In the future, new tools should make it much easier to use. In the meantime, it is possible to use a certain number of tools that already exist on the platform. Here I will introduce the FactGrid Viewer tool.
A first use of FactGrid is simply to search and browse the database. This is accessible to everyone, without the need to log in. However, the user interface (technically that of Wikidata, the platform for which Wikibase was produced) is not very engaging. In fact, it looks more like an input mask than a user interface. This is why I developed the Viewer, which allows you to browse FactGrid easily and comfortably. This post is a presentation of the tool and a user guide.
Presentation of the Viewer
The Viewer is a small Javascript application (it is written in Typescript with the help of the Angular framework, then transcompiled in Javascript) of about 1MB. This means that it runs on the user’s computer. The Viewer allows users to navigate within FactGrid by displaying data as structured pages in the language of their choice. To open the application, use this blog’s menu above (where it says FactGrid Browsers), use the left-hand sidebar under the Browse category of the wikibase platform or go directly to the address https://database.factgrid.de/viewer.
FactGrid viewer homepage
The Viewer home page is very simple. From top to bottom: (1) a banner with the logo of FactGrid on the left, three icons , and on the right; (3) the title FactGrid; (3) a simple search form; (4) a link “SPARQL query”; (5) on a black background, the list of Items already consulted on the computer (with the same browser) (max. 50) with, for each, an icon .
You have directly access to FactGrid by clicking on its logo and to this post by clicking on .
You can select the language in which you wish to display the data. The default language is English. To change the language, click on and select the language of your choice. Six languages are currently available: English, German, French, Spanish, Italian, Hungarian. Once the language is selected, the change is instantly implemented in the browser and all labels, aliases and descriptions are displayed in that language; if text is missing in the selected language, the Viewer will display the text in the default language, i.e. English, or, if the English text is also missing, in French or in German.
It is also possible to select a research area of special interest to you. By default, the search is performed on all Items in FactGrid. To limit the search to a specific theme, click on and select the theme of your choice. This feature is still in development. You can see demontration examples for Paris and the bibliography of Harmonia Universalis.
The search is done with the form (where the Ex. Goethe indication is). As you type in characters, the Viewer almost instantaneously explores the 1 million Items in FactGrid and returns those whose labels (including their aliases) begin with the characters you typed. The number of Items returned cannot exceed 50. The labels and descriptions are displayed in the selected language. To view the data for an Item, simply click on its icon .
Layout of a page
The Viewer pages are the heart of the Viewer. They enable all the data relating to the Items contained in FactGrid (label, description, aliases, statements) to be displayed in the selected language.
The Viewer organises the pages to make the data more readable and consistent. The layout is adapted to the size of the screen (responsive display), so that FactGrid can be consulted comfortably on a mobile phone as well as on a large screen. See the example of the page of Johann Wofgang von Goethe.
A page on the Viewer consists of one horizontal strips and five blocks.
The strip
Above the strip a “new search” link takes you back to the home page. On the strip, a “linked pages” link with a chevron leads to the left-hand removable panel.
The header block and the statement block
The two main blocks (see the case of Ahaha), on a white background, are :
(1) The header block. It includes the label of the Item in large type, followed by all its aliases and description, its Q-ID (clickable to go to the Item FactGrid page) and a series of general statements. The first of these statements indicates the “Instance of” for the Item (for example: Human(s)). This statement is mandatory. If it is missing, the Viewer displays a warning message. Other optional statements may follow, like “Subclasses of”, “FactGrid research area”, “Research projects that contributed to this data set”, etc. The labels are displayed without description.
(2) The statement block. This block contains all the statements related to the Item, except for the general statements in the header and the external links. A statement must consist of a property and an object (which can itself be a FactGrid Item). The statement block can be divided into thematic sub-blocks, the theme of which is indicated by a title in red (e.g. “Education”, “Career and activities”, “Sociability and culture”, etc.).
Statements grouped by property
The statements in a block are grouped by property. In a group the property label is displayed in bold blue (e.g. “Educative institution”) and the object labels are displayed below in black with an indentation, each on one line, followed in general by their description in grey (except in the general thematic block where the descriptions, almost always obvious, have been considered unnecessary). An icon may be used to go to the corresponding page.
A statement may include additional information. Firstly, there are qualifiers (e.g. a date or a place). These are displayed with an indentation after the main information on the object in smaller characters (the name of the qualifier, i.e. the label of the corresponding property, is in blue italics, the label of the object is in black roman and the description in grey). Then there are the references (e.g. the mention of a source) with an indentation, also in small print (the name of the reference, i.e. the label of the corresponding property, is in red italics, its object is in black roman and the description in grey). The statements of the same group are automatically ordered chronologically when date qualifiers exist.
The image block and the link block
The five other blocks are :
(1) The image block where illustrations relating to the Item may be displayed. This block is at the top right on a computer screen and just below the title of the page on a mobile phone screen.
(2) The link block, with a yellow background, where external links and Wiki links (e.g. links to Wikidata or Wikipedia pages) are displayed. This block is on the right on a computer screen (below the image block when it exists) and below the main blocks on a mobile phone screen.
(3) The block of pages already consulted on the computer (with the same browser) (max. 50), on a black background, with an icon for each one (this block is also present on the home page). This block is on the right below the link block on a computer screen and below the statement block on a mobile phone screen.
(4) The info block on the bottom of the statement block, accessible by clicking the icon on the blue strip, contains useful information on the Q-Item: the tree of classes to which it belongs as an instance and, in case the Q-Item is itself a class, the tree of its superclassses and a list of its instances (limit = 200).
(5) The block on the left-hand side panel, accessible by clicking on “linked pages”, contains a list of all the pages which are linked to the displayed Item, i.e. for which there is a statement (main statement or qualifier) whose object is the displayed Item. An icon allows you to go to the Item page. By clicking on “main page”, you come back to the item page.
Other features
In addition, the Viewer gives access to many additional pieces of information obtained by SPARQL queries, for instance:
– in the page of a family name, the list of the people in FactGrid bearing this name; ex: Müller.
– in the page of an institution (for instance a learned society), the list of the people in FactGrid who are members of this institution; ex: the mesmerist Society of Harmony in Paris.
– in the page of an address, the list of the people in FactGrid living at this address; ex: Square d’Orléans, no. 9 in Paris, where the composer Frédéric Chopin lived from 1842 to 1849.
– in the page of an occupation, the list of the people in FacGrid having this occupation: see, for instance, the cas of landscape painter.
Landscape painters in FactGrid
and many others…
When there are more than 15 items in the list, a search form can be used to filter items by label and description. The filtered items can be downloaded by clicking on the icon .
the Viewer displays on OpenStreetMap the location corresponding to the geographical coordinates declared for an Item (for example a city like Paris or an address, like the real estate at Johannisgasse 15 .
an old address in Leipzig
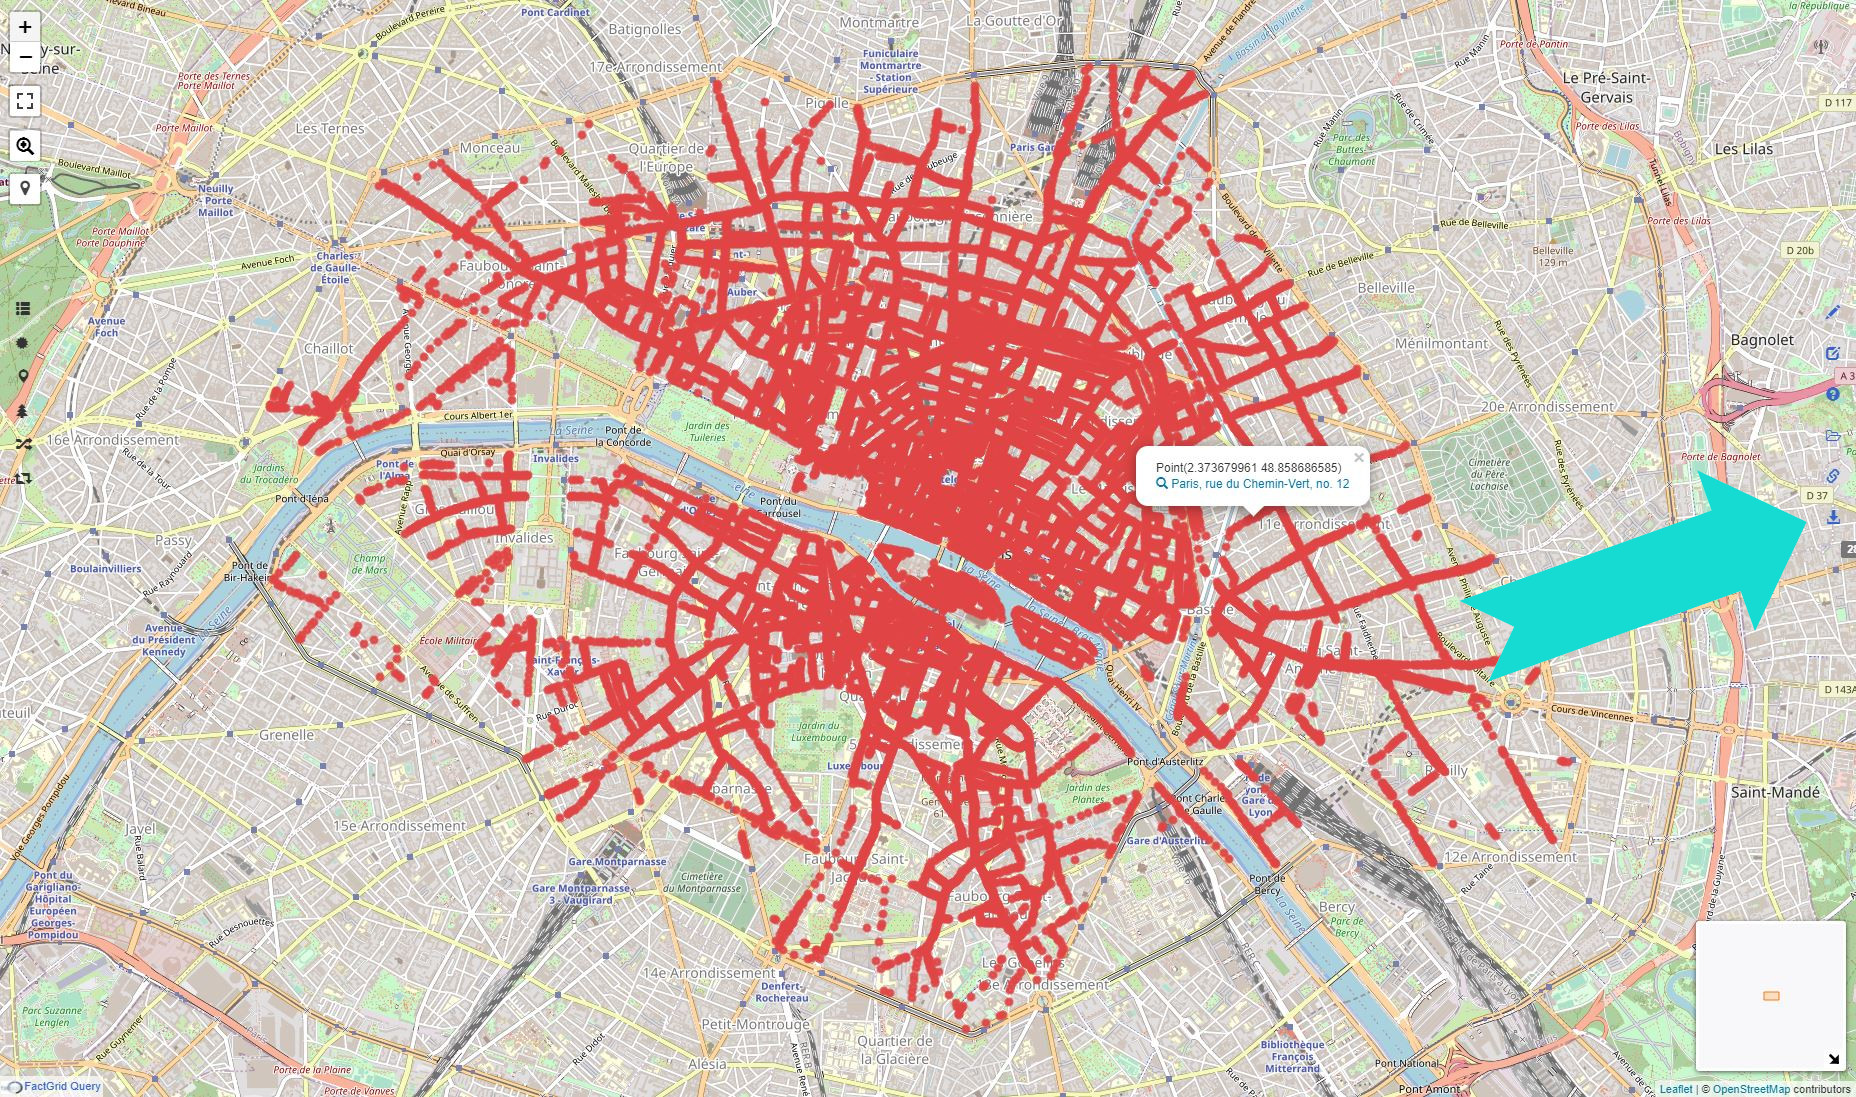
The Viewer also displays the locations corresponding to the geographical coordinates declared for a set of Items obtained by a SPARQL query.
Paris, rue de la Paix
For example, on the page of the Rue de la Paix in Paris, there are two maps: a map with the location of the street and a map with all the house numbers of this street in early Nineteenth century. The second map is the product of a SPARQL query.
The FactGrid viewer also includes a SPARQL query service in the Viewer with a model. It must be used in the same way as the FactGrid query service, keeping the two bottom lines (introduced by BIND) in order to generate for each returned item a ?viewer link to the Viewer.
The Viewer can be improved. Feel free to comment. Any suggestions are welcome at bbelhoste@gmail.com.
FactGrid is a graph database. If you run searches in such a database you should rather not think of a resource filled with interrelated tables (of people, places, organizations, documents…) – but of something more spatial, more geometric, more graphic.
Think of your own knowledge. You will not be able to give a table of all the names that have a meaning in your knowledge, or of all the places related to these names. Our knowledge is more like a web of interrelated objects. Nicolaus Copernicus? He is the man who wrote De revolutionibus. What else do you know? Maybe that he was born in Thorn, Polish Toruń, and that he studied at the Universities of Padua and Bolognia. I at least do not immediately know much more about the author who brought about the “Copernican Revolution”. That, of course, is an object that rings many more bells, with all the connections to other items of knowledge it has in my knowledge. I can add that these two universities were good places to study those subjects that were to become the natural sciences – but that again is knowledge on these objects, not on Copernicus, knowldge that got stuck in my knowledge as it added some more colour to my knowledge about Copernicus, the person. Think of interrelated objects hanging together in the wider mesh of your knowledge – of objects that link to each other like atoms in a molecule.
…an object with links to two other objects? That could be someone linked to her two parents. The graph would not look different if that was another person with his two daughters, or Copernicus with links to the two universities mentioned. Well, Copernicus studied at four universities, to be precise – but that is not the problem.
The problem is that the molecular model does not carry particularly well as it puts all the differences into the atoms, hence the various colours in images and the different connectivities of atoms in the typical three dimensional tool kits. In a database like FactGrid all the objects are structurally completely identical. They all are just “Items”: meaningless points, “nodes”, under Q-numbers counted up from 1 to infinity. The various and very specific Properties between the objects make all the differences in a graph database: “Fathers” are in FactGrid Items that have P141 “father” properties referring to them; mothers have P142 Properties linking from other items towards them.
In a triple-based database (which breaks down all knowledge into three-part statements) we will need no more than two sorts of components: You can take spheres for the objects of our knowledge, the “Items”, and arrows for the links that run between them – arrows as we have to express directions in the various statements.
Those who studied at the University of Jena have P160 “educating institution” statements leading from their Items to the University of Jena Item Q21880. This is the SPARQL script (see this link to see what it does):
SELECT ?Item ?ItemLabel WHERE {
SERVICE wikibase:label { bd:serviceParam wikibase:language “[AUTO_LANGUAGE],en”. }
?Item wdt:P160 wd:Q21880.}
SPARQL is a wonderfully versatile language to send searches through graph databases but it is impossible to script even this most simple query without handbook knowledge. What is worse: You will need additional knowledge of our database to know that Jena’s University has this the Q-number Q21880 and that students must have P160 statements on them that will link to this University with the Q21880 indetifier.
The Wikimedia Query Helper is the coolest gadget as soon as you understand what a “Filter” can do for you in your query. Once you realise that this is the input field that will need the university in your specific query you can start to type “Univ…” and the autocomplete will lead you to the Q-number you are looking for. Select the Item you are interested in and the tool will already propose the “who studied here?” Property P160 as this is the most used Property leading to Q21880. It is fair to assume you are looking for people who studied at this university.
You can now ask for more information about these students as far as they are found on their Items, such as the dates of birth and death with both places in separate columns, and the names of their fathers and mothers. This is a search that uses the Query Helper:
And this is where the present Query Helper will leave you. The coordinate locations of the places of birth are on their respective Items (not on the student Items which you have been exploring so far). You need these coordinates to get a map representation, but the Query Helper does not show you how to extend your search into the related objects, nor does it show you how to bring qualifiers into your list (like the matriculation begin and end dates stated with many of the P160 links). It is also difficult to switch to reverse questions. You already know the person and now you want to know more about him, while you are still asked to use a filter…
One should have a graphic – a visual – query editor on a graph database
This is what the open question looks like: Who studied where? I put numbers in the circles to designate table columns.
If you are only interested in Jena University students, you should be able to specify that right on the university’s Item. Click into its sphere and type “University of Jena” into the circle:
You can now expand the query as you wish with clicks into the objects or the arrows, for example by asking for the “fathers” (P141) of these sutudents, who will appear in column 3 (this script):
And it will now be easy to get more information from the fathers – like which schools and universities did the fathers attend, again P160 (script link)?
One could also formulate the short-circuit question to get all the students who studied in Jena just as their fathers had done before:
I gave the arrows in different colours because they are the components that make all the difference in objects. You want to spot identical questions and similar objects in your searches.
Optional / Mandatory
Perhaps a simple exclamation mark on the Property arrows would be enough to mark statements that shall work as filters.
Qualifiers
Qualifying statements are a bright Wikibase invention. Any primary triple can become the object of specific, qualifying statements. That is basically the relative clause we need in such a language (for instance if we have a person who studied at four universities and we want to say from when to when on each case). If we want to keep the graphic repertoire lean, we could simply link the qualifying statements to the Properties – for example, to get two separate columns for the begin and end dates of a specific university matriculation:
Opening the toolbox
The toolbox had been open in these various searches. I used it so far to state where a specific Item had a specific value attached to it. We would use this toolbox for all the more complex visualisations. Imagine you want to get the religious backgrounds of all known Illuminati in a bubble chart. Ask for the Items that have a P91 membership statement connected to the Illuminati, Q10677. Then ask for their religious backgrounds. If you want a bubble chart you need a count of hits on each religion and denomination:
The toolbox should also be the place to create time frames. You could here specify ranges on data you have requested.
Just a thought…
A Postscript on how to use the right and left mouse buttons in the query builder
Visual scripting might be actually quite easy. With the left mouse button you create your first circle. It will come with a question mark in it.
Click into this circle with the left mouse button, and you can put a value into this circle, a label; it will replace the question mark.
Use your right hand mouse button to get a visual context menu from his point. It will come in the form of grey options to select. Two arrows are leading away from your Item, two are leading towards it. Each time you get an open offer with question marks to replace (or to leave there) and two specific arrows that will give you ideas of what is happening here:
With the left mouse button you can select the direction into which you want to move, the selected arrow and circle will switch to colour, the other three arrows will disappear. You are now free to continue with a click into the next Item or Property of your interest. Just as in the current Query Helper, you will always get a preview of 20 table rows, that will give you an idea of the results you are about to get on your search.
Die Universität Erfurt lud uns ein, im kommenden Sommersemester eine online Coffee-Talk Serie zum FactGrid als kollaborativer Forschungsplattform zu veranstalten. Neun Themenschwerpunkte haben wir ausgesucht. Die Veranstaltungen sollen kurz und für die Mittagspause zum Hineinschnuppern gemacht sein. Lassen Sie sich inspirieren. Wir bieten eine 15minütige Erkundung mit jeweils offener Fragerunde.
14.4.2022: Sich beim Forschen über die Schulter sehen lassen? — Isabella Schwaderers Erkundungen zu den Mitgliedern der Schopenhauergesellschaft
Netzwerkverbindungen in der Schopenhauergesellschaft, 1912, 1913
Kann man es riskieren, auf einer Plattform, auf der alle Daten unmittelbar offen zugänglich sind, die eigene gerade erst angefangene Forschung laufen zu lassen? Isabella Schwaderer tat diesen Schritt mit ihren Recherchen zu den Mitgliedern der Deutschen Schopenhauergesellschaft und wird hier Einblicke in die Nutzerperspektive geben. Worauf lässt man sich ein? Was ist praktisch? Was ist unpraktisch? Was riskiert man? Was gewinnt man?
21.4.2022: Was immer eine Aussage finden kann, kann ein Datenbank-Item werden — wie Wikibase funktioniert
Wikibase steht im Ruf, ganz beliebige Information aufnehmen zu können. Auf einer einzigen Instanz kann man Information ganz verschiedener Fächer zusammenlaufen lassen und sie nahtlos über alle Fachgrenzen hinweg durchdringen.
Das Geheimnis liegt in der Flexibilität Tripel-basierter Daten. Wir können beliebige Objekte aufmachen und Aussagen zu ihnen beliebig an dokumentierte Datenstrukturen anpassen. Die Eingabe ist einfach. Komplizierter und offener ist, wie man die Daten danach in ihrer ganzen Vernetzung intelligent auswertet.
Jahrzehntelang kämpfte man in der Bibliothekslandschaft um globale Datenmodelle und verbindliche Datenbank-Feldbelegungen in der Hoffnung, auf sichere Standards. All das hat das Wikidata-Projekt in seiner mutmaßlichen Notwendigkeit relativiert mit dem Angebot einer einzigen Ressource, die jede in ihr gespeicherte Aussage jederzeit in über 400 Sprachen verfügbar macht.
Wie das geht, ist im wörtlichen Sinne trivial: Alle Aussagen werden zerlegt in Datentripel von jeweils zwei Objekten und einer Beziehung zwischen ihnen, deren Teile man nun einzeln in beliebigen Sprachen mit beliebig vielen Labeln belegen kann. Tatsächlich können auf einer solchen Plattform Nutzer, ohne noch über eine gemeinsame Sprache zu verfügen, die Daten aller anderen in der eigenen Sprache lesen – eine gewaltige Chance für Projekte, die in Teams über Sprachgrenzen hinweg zusammenarbeiten sollen.
Ein Blick auf das Wikidata-Projekt, seine Software und Mehrsprachigkeit im FactGrid.
5.5.2022: Selbstorganisation über Projektgrenzen hinweg
Das FactGrid arbeitet ohne zentrale Redaktion, die Daten erst einmal ansehen und auf ihre Qualität hin überprüfen würde. Auch gibt es keine “Relevanzkriterien” – keine Kriterien, die festlegen, was für Daten in die Datenbank dürfen. Wir arbeiten mit einer verwirrenden Offenheit, die dafür ganz eigene Grenzen hat: Forschungsprojekte (auch private) stehen für ihre Arbeit extrem transparent ein. Wir sind hier an einigen interessanten Stellen anders organisiert als Wikidata.
Wie das in der Praxis geht, welche Konflikte man einkalkulieren und welche Konfliktzonen man eher nicht fürchten sollte – Erkundungen der Plattform-Architektur und der speziellen Freiräume, die wir in ihr Projekten gewähren.
12.5.2022, unusual time 18:00 CET: 350,000 objects with cuneiform inscriptions or: Data as a universal language — session in English with Adam Anderson, Berkeley
This is perhaps the most exciting FactGrid project at the moment – designed to create and to interconnect objects for all 350,000 cuneiform artifacts that known today. Where were these objects found? What events, what people, what places are noted on these objects? As a Wikibase installation we would serve as a database a wide collectively could work on and edit simultaneously in all its various present languages. Data stored on the platform would link into other databases and they would be uniquely easy to download for further work in all other software environments.
Our discussion was about the sheer quantities of data such a platform might eventually handle – if we went into the very texture of these objects, locating not only pieces of information but in further steps all the characters on all these objects in 3D data of the artifacts themselves.
19.5.2022: Georeferenzierte Objekte — Session with Bruno Belhoste in English
Eine Aufgabe, vor der DH-Projekte immer wieder stehen, ist es, Information auf Landkarten zu visualisieren. Räumliche Beziehungsnetze werden sichtbar, Nähe wird greifbar wie der Horizont, den Verfasser mit Korrespondenzen hatten. Soziale Phänomene, etwa die Zusammensetzung der Bevölkerung in verschiedenen Stadtvierteln, lassen sich erfassen. FactGrid-Information ist jederzeit georeferenzierbar. Wir bieten Georeferenzierungen in einem ersten Projekt – Paris to Download – zur beliebigen Nutzung auf der Plattform oder in anderen Software-Umgebungen an. Einige Blicke auf die Projekte und die Software, die hier nach neuen Modulen ruft.
9.6.2022: Genealogie im FactGrid – mehr als nur Väter und Mütter
What came after Robinson Crusoe’s first edition? EntiTree Visualisation
FactGrid-Information lässt sich komplex in externe Projekte hineinspielen. Zwei FactGrid Browsing-Tools stehen zu Verfügung. Es lassen sich jedoch auch ganz andere Werkzeuge denken.
Als überraschend vielseitig verwendbar erweist sich die von Orlando Groppo und Martin Schibel entwickelte EntiTree-App, die Genealogien auf bequeme Art und Weise mehrsprachig sichtbar macht. Spannende ist dass sich mit der EntiTree App auch noch ganz andere genealogische Beziehungen darstellen lassen.
16.6.2022: Die Zukunft im NFDI4Memory Gefüge – oder: Dateninseln zu neuem Leben erwecken
Das FactGrid ist seit 2021 gesetzt, um im geplanten NFDI4Memory-Konsortium der deutschen Geschichtswissenschaften als Wikibase-Instanz zur Verfügung zu stehen. Forschungsdatenmanagement ist hier das Thema. Was geschieht mit Forschungsdaten, die am Ende irgendwie übrigbleiben – gesammelt, um den Arbeitsprozess zu begleiten, doch danach irgendwie nutzlos, indes voller Korrekturen und Einblicke, die zukünftiger Forschung nutzen sollten? Was geschieht mit Daten, die bislang auf einer eigenen Plattform laufen, nachdem deren Förderung endet? Wie kann man Daten langfristig sichern?
Das FactGrid will hier die Ressource sein, die Information kollektiv nutzbar macht und langfristig in Zirkulation und Korrektur hält. Praktische Tipps, wie das gehen könnte.


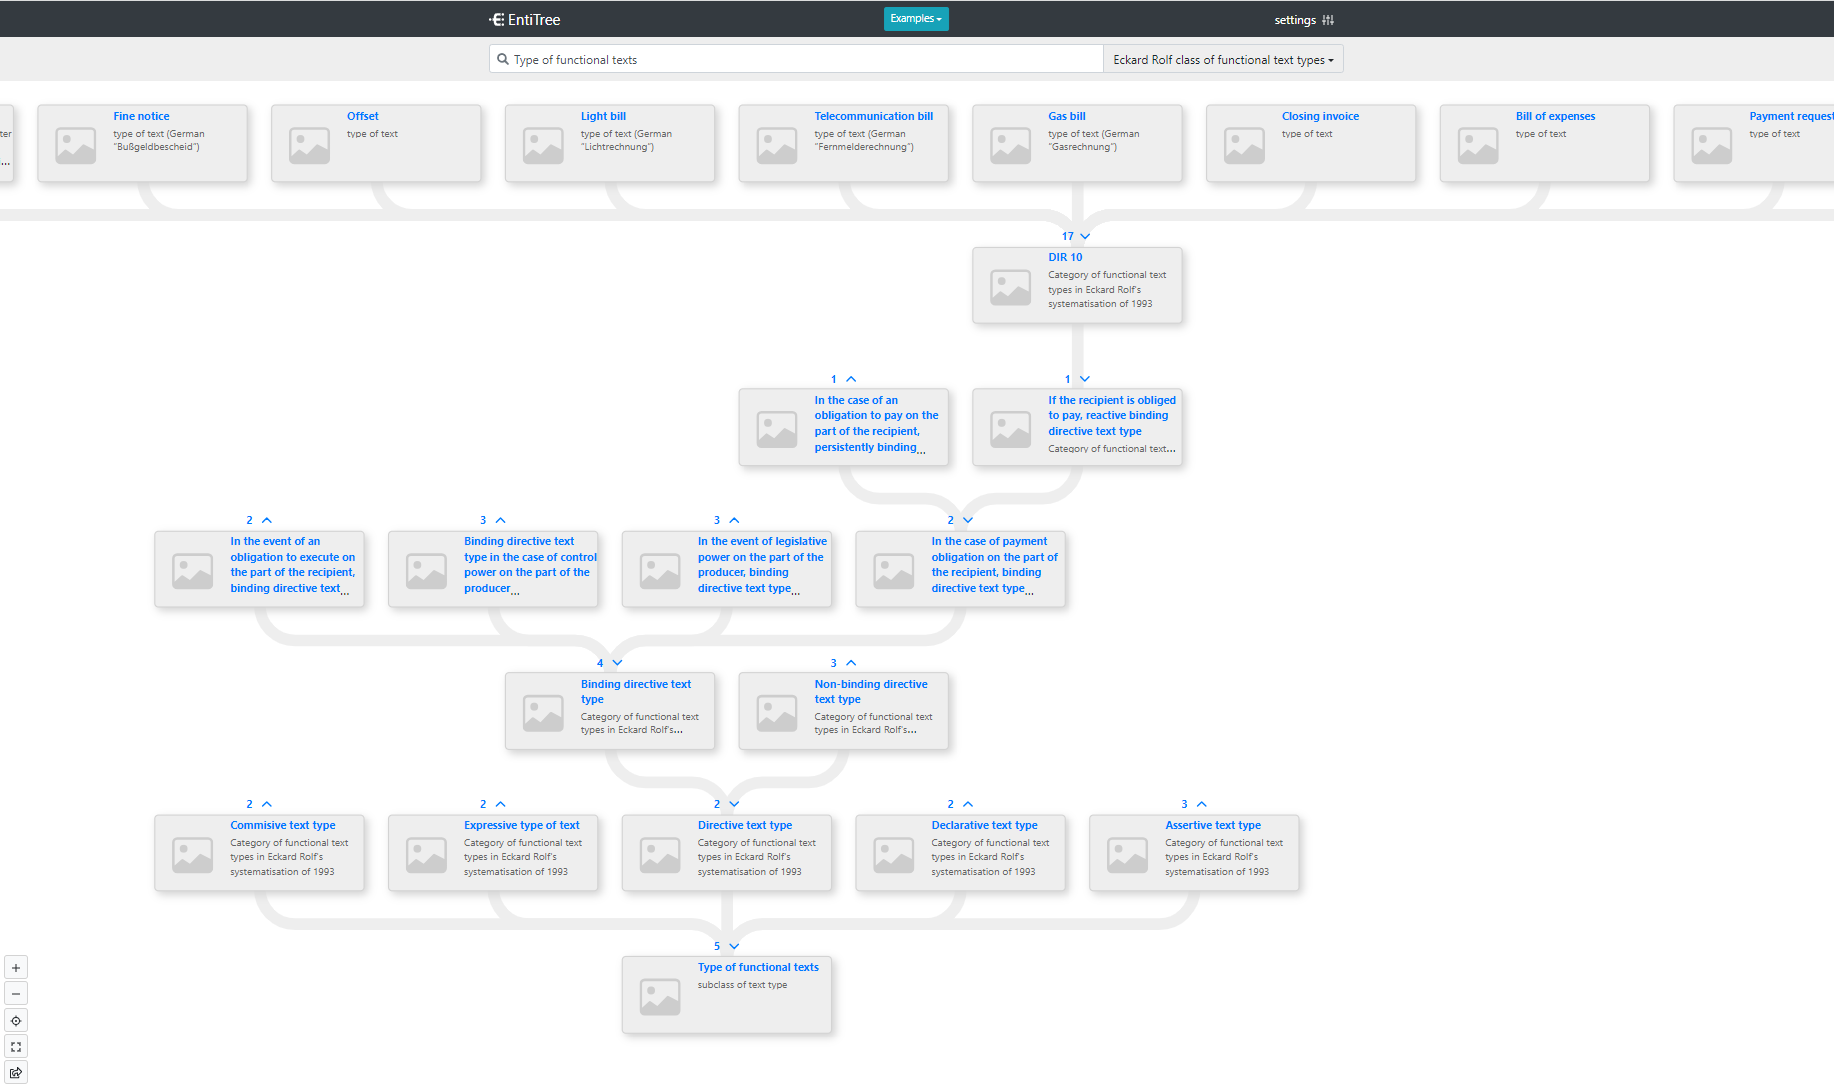


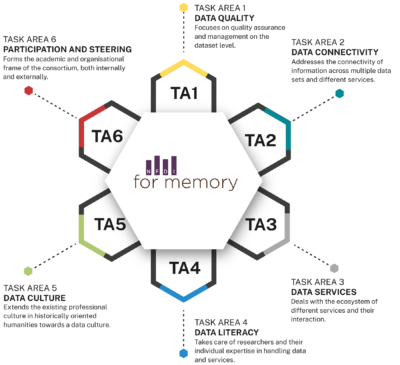

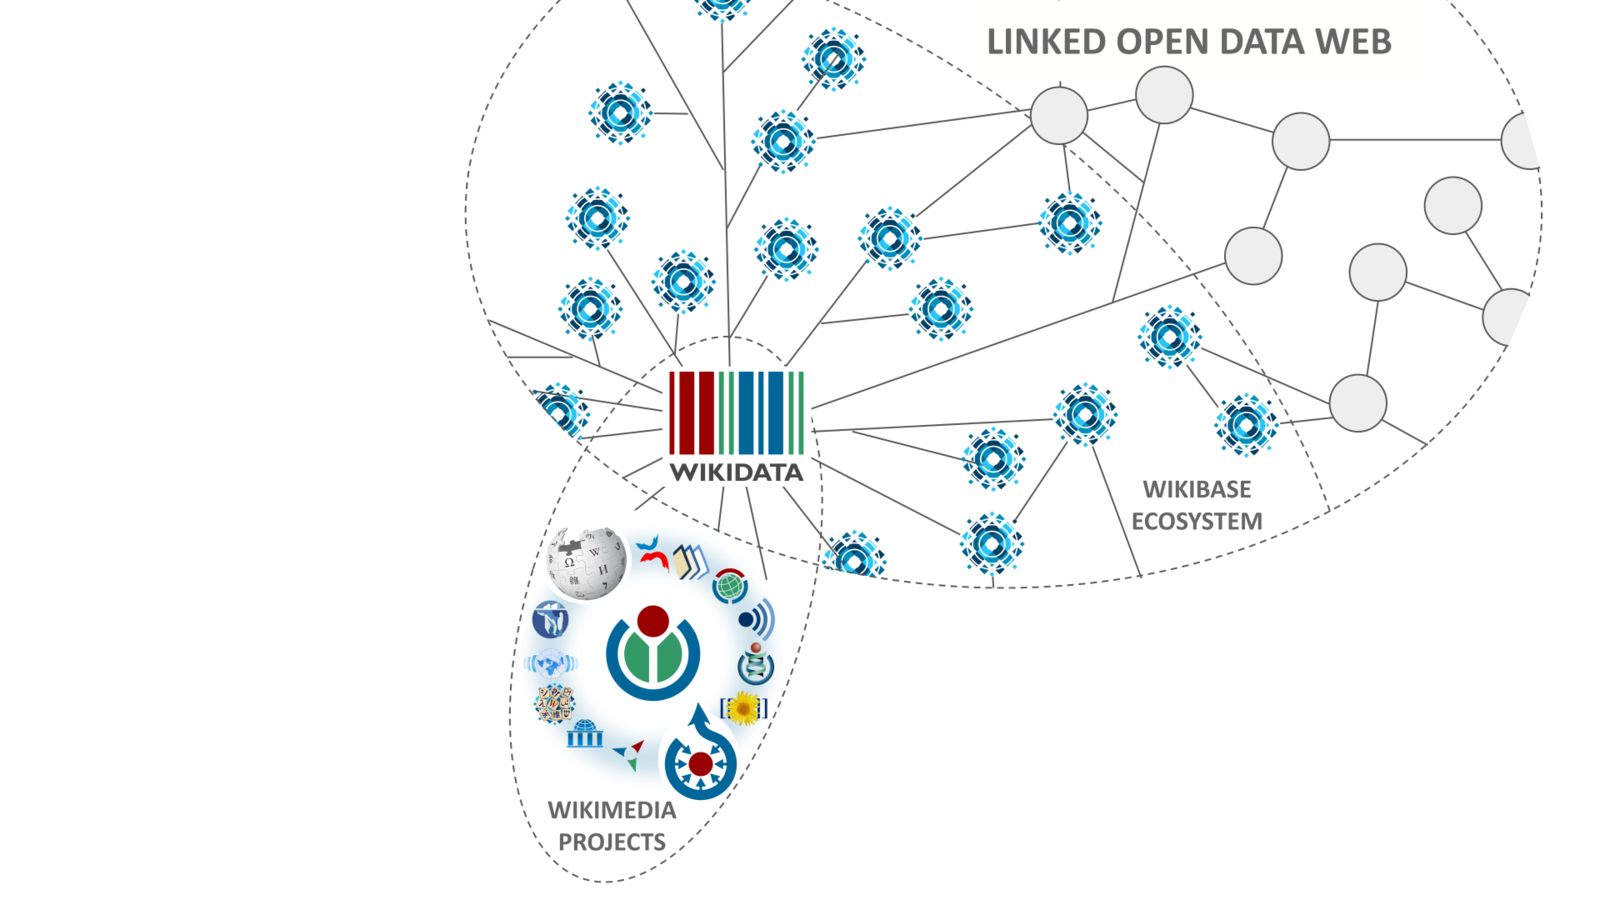

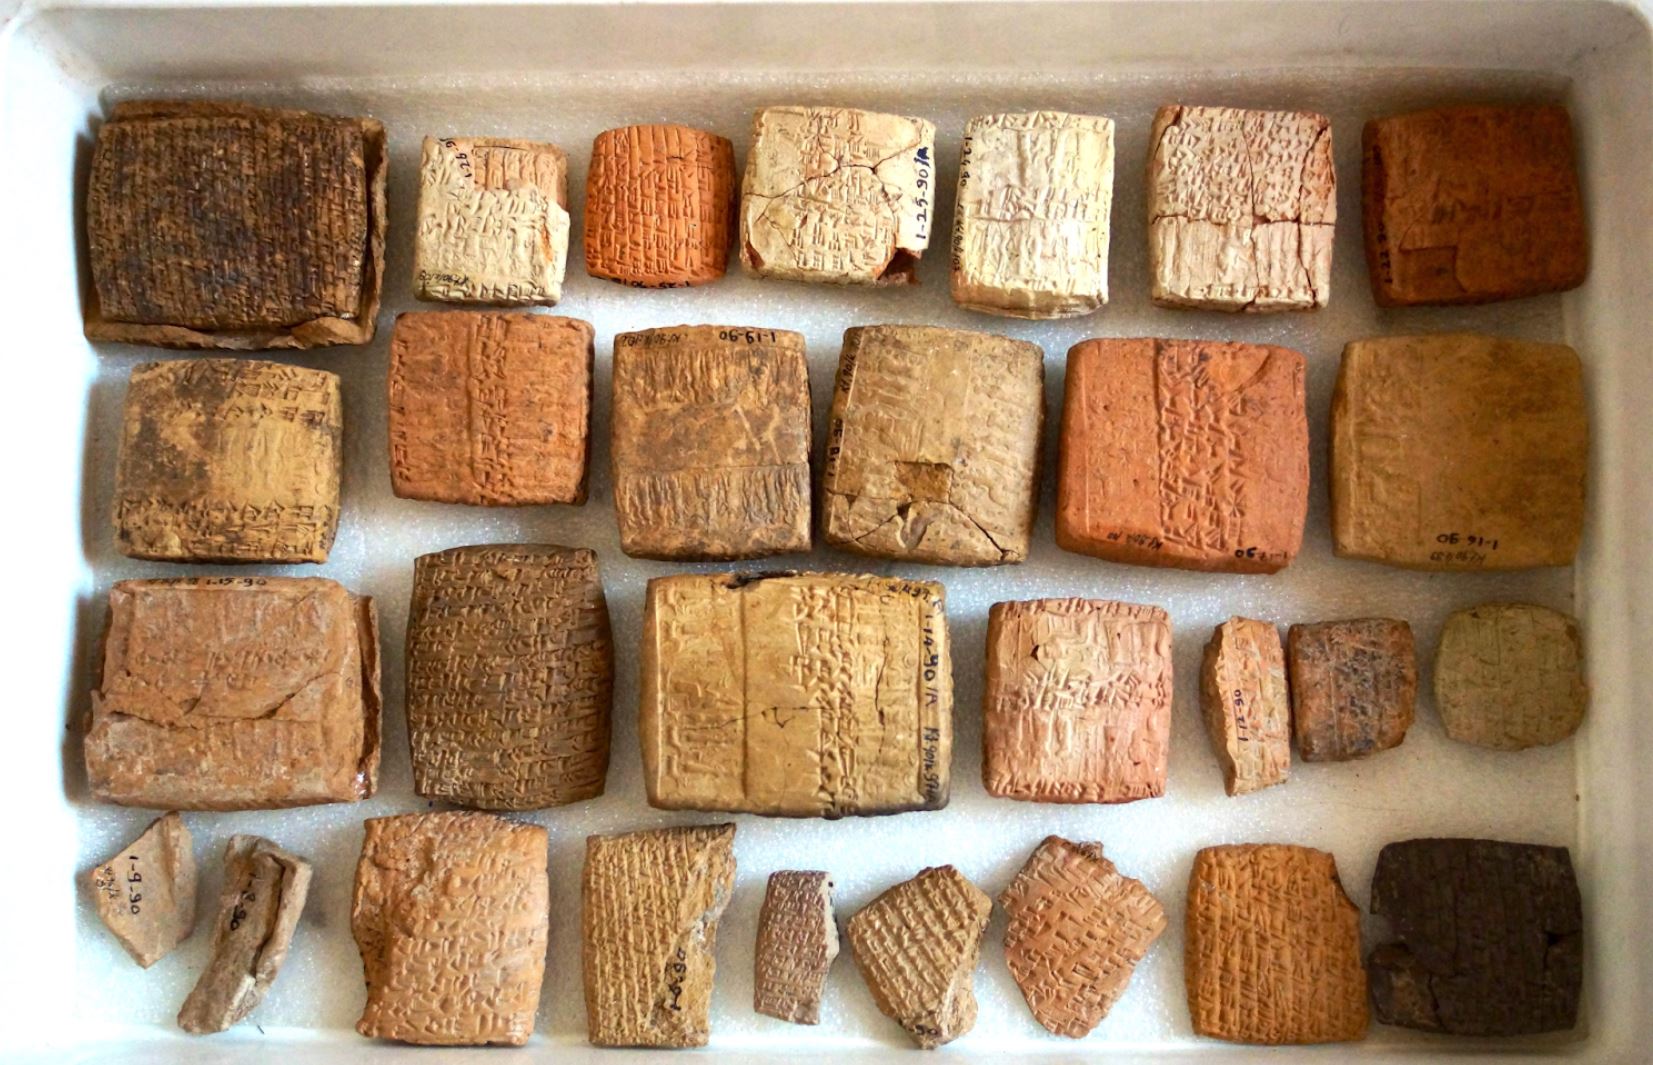


 ,
,  and
and  on the right; (3) the title FactGrid; (3) a simple search form; (4) a link “SPARQL query”; (5) on a black background, the list of Items already consulted on the computer (with the same browser) (max. 50) with, for each, an icon
  .
.


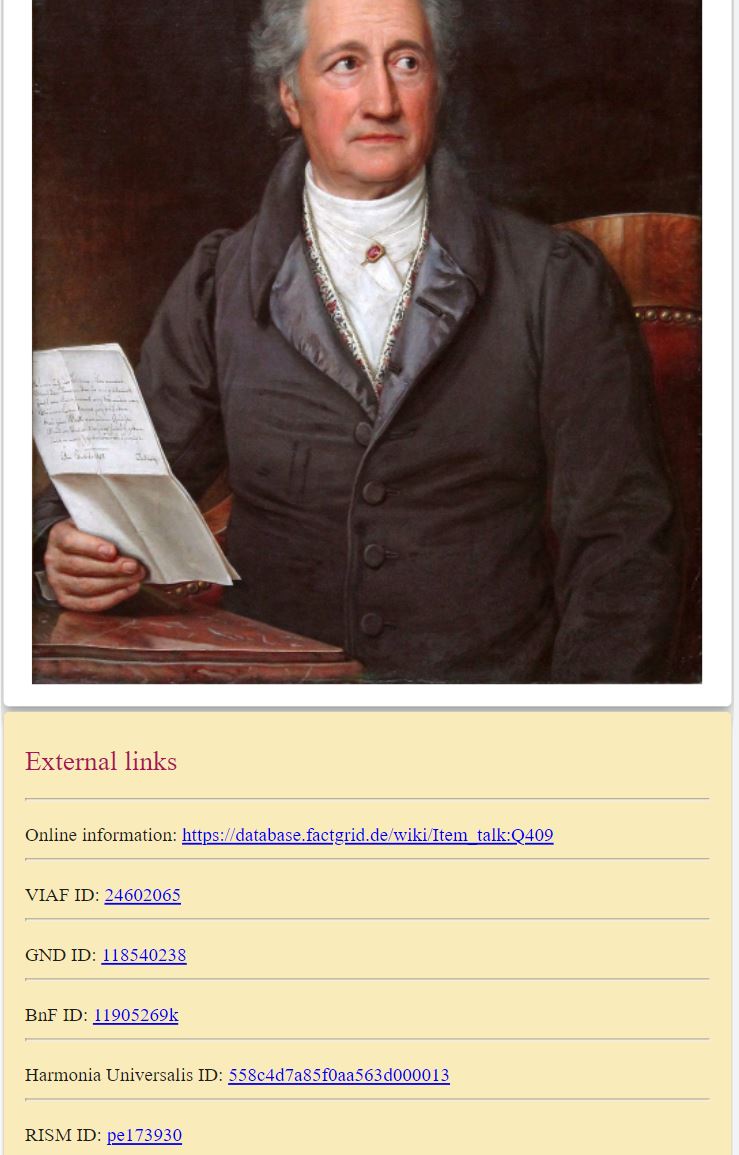
 on the blue strip, contains useful information on the Q-Item: the tree of classes to which it belongs as an instance and, in case the Q-Item is itself a class, the tree of its superclassses and a list of its instances (limit = 200).
 .
.