Browsing FactGrid with the FactGrid Viewer

update: 25-05-2024

FactGrid is a wonderful, free and collaborative resource that the Gotha Research Center of the University of Erfurt in Germany has made available to the international historical community through the efforts of Olaf Simons. Many potential users are unfortunately put off by its apparent complexity. It is true that an initiation is necessary to exploit all its possibilities. In the future, new tools should make it much easier to use. In the meantime, it is possible to use a certain number of tools that already exist on the platform. Here I will introduce the FactGrid Viewer tool.

A first use of FactGrid is simply to search and browse the database. This is accessible to everyone, without the need to log in. However, the user interface (technically that of Wikidata, the platform for which Wikibase was produced) is not very engaging. In fact, it looks more like an input mask than a user interface. This is why I developed the Viewer, which allows you to browse FactGrid easily and comfortably. This post is a presentation of the tool and a user guide.

Presentation of the Viewer

The Viewer is a small Javascript application (it is written in Typescript with the help of the Angular framework, then transcompiled in Javascript) of about 1MB. This means that it runs on the user’s computer. The Viewer allows users to navigate within FactGrid by displaying data as structured pages in the language of their choice. To open the application, use this blog’s menu above (where it says FactGrid Browsers), use the left-hand sidebar under the Browse category of the wikibase platform or go directly to the address https://database.factgrid.de/viewer.

FactGrid viewer homepage

The Viewer home page is very simple. From top to bottom: (1) a banner with the logo of FactGrid on the left,  three icons , and   on the right; (3) the title FactGrid;  (3)  a simple search form; (4) a link “SPARQL query”; (5) on a black background, the list of Items already consulted on the computer (with the same browser) (max. 50) with, for each, an icon .

You have directly access to FactGrid by clicking on its logo and to this post by clicking on .

You can select the language in which you wish to display the data. The default language is English. To change the language, click on and select the language of your choice. Six languages are currently available: English, German, French, Spanish, Italian, Hungarian. Once the language is selected, the change is instantly implemented in the browser and all labels, aliases and descriptions are displayed in that language; if text is missing in the selected language, the Viewer will display the text in the default language, i.e. English, or, if the English text is also missing, in French or in German.

It is also possible to select a  research area of special interest to you. By default, the search is performed on all Items in FactGrid. To limit the search to a specific theme, click on and select the theme of your choice. This feature is still in development. You can see demontration examples for Paris and  the bibliography of Harmonia Universalis.

The search is done with the form (where the Ex. Goethe indication is). As you type in characters, the Viewer almost instantaneously explores the 1 million Items in FactGrid and returns those whose labels (including their aliases) begin with the characters you typed. The number of Items returned cannot exceed 50. The labels and descriptions are displayed in the selected language. To view the data for an Item, simply click on its icon .

Layout of a page

The Viewer pages are the heart of the Viewer. They enable all the data relating to the Items contained in FactGrid (label, description, aliases, statements) to be displayed in the selected language.

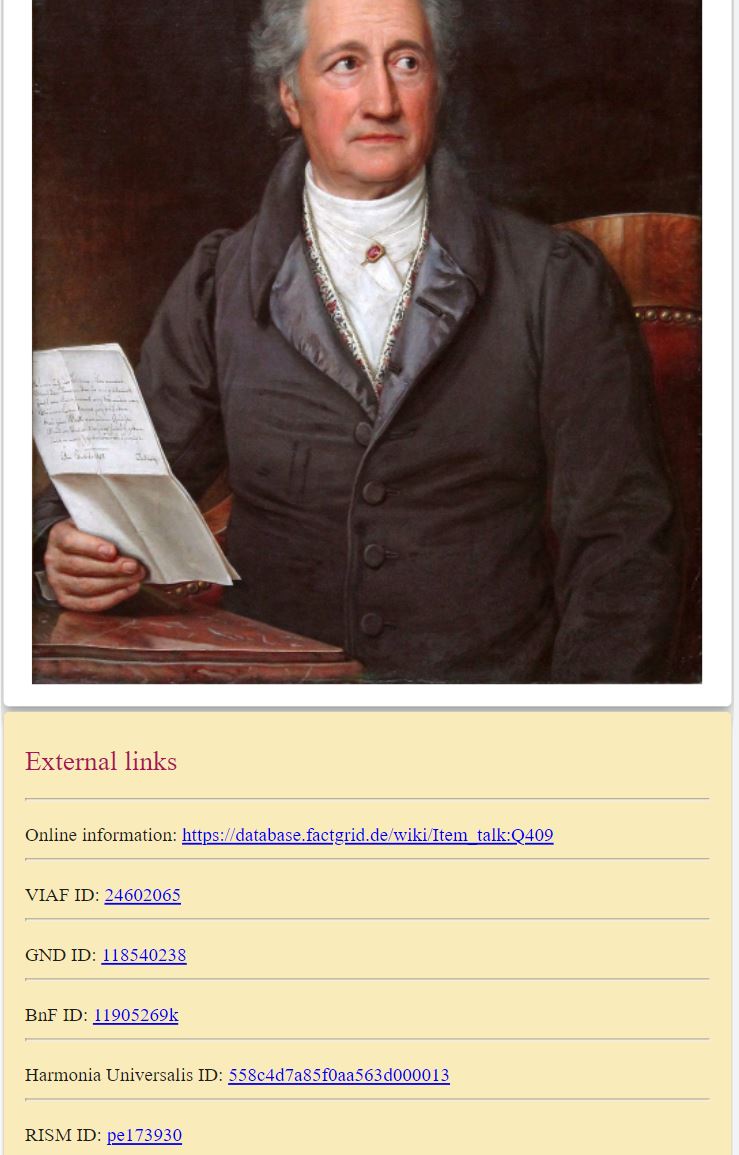
The Viewer organises the pages to make the data more readable and consistent. The layout is adapted to the size of the screen (responsive display), so that FactGrid can be consulted comfortably on a mobile phone as well as on a large screen. See the example of the page of Johann Wofgang von Goethe.

A page on the Viewer consists of one horizontal strips and five blocks.

The strip

Above the strip a “new search” link takes you back to the home page. On the  strip, a “linked pages” link with a chevron leads to the left-hand removable panel.

The header block and the statement block

The two main blocks (see the case of Ahaha), on a white background, are :

(1) The header block. It includes the label of the Item in large type, followed by all its aliases and description, its Q-ID (clickable to go to the Item FactGrid page) and a series of general statements. The first of these statements indicates the “Instance of” for the Item (for example: Human(s)). This statement is mandatory. If it is missing, the Viewer displays a warning message. Other optional statements may follow, like “Subclasses of”, “FactGrid research area”, “Research projects that contributed to this data set”, etc. The labels are displayed without description.

(2) The statement block. This block contains all the statements related to the Item, except for the general statements in the header and the external links. A statement must consist of a property and an object (which can itself be a FactGrid Item). The statement block can be divided into thematic sub-blocks, the theme of which is indicated by a title in red (e.g. “Education”, “Career and activities”, “Sociability and culture”, etc.).

Statements grouped by property

The statements in a block are grouped by property. In a group the property label is displayed in bold blue (e.g. “Educative institution”) and the object labels are displayed below in black with an indentation, each on one line, followed in general by their description in grey (except in the general thematic block where the descriptions, almost always obvious, have been considered unnecessary). An icon may be used to go to the corresponding page.

A statement may include additional information. Firstly, there are qualifiers (e.g. a date or a place). These are displayed with an indentation after the main information on the object in smaller characters (the name of the qualifier, i.e. the label of the corresponding property, is in blue italics, the label of the object is in black roman and the description in grey). Then there are the references (e.g. the mention of a source) with an indentation, also in small print (the name of the reference, i.e. the label of the corresponding property, is in red italics, its object is in black roman and the description in grey). The statements of the same group are automatically ordered chronologically when date qualifiers exist.
The image block and the link block

The five other blocks are :

(1) The image block where illustrations relating to the Item may be displayed. This block is at the top right on a computer screen and just below the title of the page on a mobile phone screen.

(2) The link block, with a yellow background, where external links and Wiki links (e.g. links to Wikidata or Wikipedia pages) are displayed. This block is on the right on a computer screen (below the image block when it exists) and below the main blocks on a mobile phone screen.

(3) The block of pages already consulted on the computer (with the same browser) (max. 50), on a black background, with an icon for each one (this block is also present on the home page). This block is on the right below the link block on a computer screen and below the statement block on a mobile phone screen.

(4) The info block on the bottom of the statement block, accessible by clicking the icon on the blue strip, contains useful information on the Q-Item: the tree of classes to which it belongs as an instance and, in case the Q-Item is itself a class, the tree of its superclassses and a list of its instances (limit = 200).

(5) The block on the left-hand side panel, accessible by clicking on “linked pages”, contains a list of all the pages which are linked to the displayed Item, i.e. for which there is a statement (main statement or qualifier) whose object is the displayed Item. An icon allows you to go to the Item page. By clicking on “main page”, you come back to the item page.

Other features

In addition, the Viewer gives access to many additional pieces of information obtained by SPARQL queries, for instance:
– in the page of a family name, the list of the people in FactGrid bearing this name; ex: Müller.
– in the page of an institution (for instance a learned society), the list of the people in FactGrid who are members of this institution; ex: the mesmerist Society of Harmony in Paris.
– in the page of an address, the list of the people in FactGrid living at this address; ex: Square d’Orléans, no. 9 in Paris, where the composer Frédéric Chopin lived from 1842 to 1849.
– in the page of an occupation, the list of the people in FacGrid having this occupation: see, for instance, the cas of  landscape painter.

Landscape painters in FactGrid

and many others…

When there are more than 15 items in the list, a search form can be used to filter items by label and description. The filtered items can be downloaded by clicking on the icon .

the Viewer displays on OpenStreetMap the location corresponding to the geographical coordinates declared for an Item (for example a city like Paris or an address, like the real estate at Johannisgasse 15 .

an old address in Leipzig

The Viewer also displays the locations corresponding to the geographical coordinates declared for a set of Items obtained by a SPARQL query.

Paris, rue de la Paix

For example, on the page of the Rue de la Paix in Paris, there are two maps: a map with the location of the street and a map with all the house numbers of this street in early Nineteenth century. The second map is the product of a SPARQL query.

The FactGrid viewer also includes a SPARQL query service in the Viewer with a model. It must be used in the same way as the FactGrid query service, keeping the two bottom lines (introduced by BIND) in order to generate for each returned item a ?viewer link to the Viewer.

The Viewer can be improved. Feel free to comment. Any suggestions are welcome at bbelhoste@gmail.com.

See the GitHub repository.
Paris to download

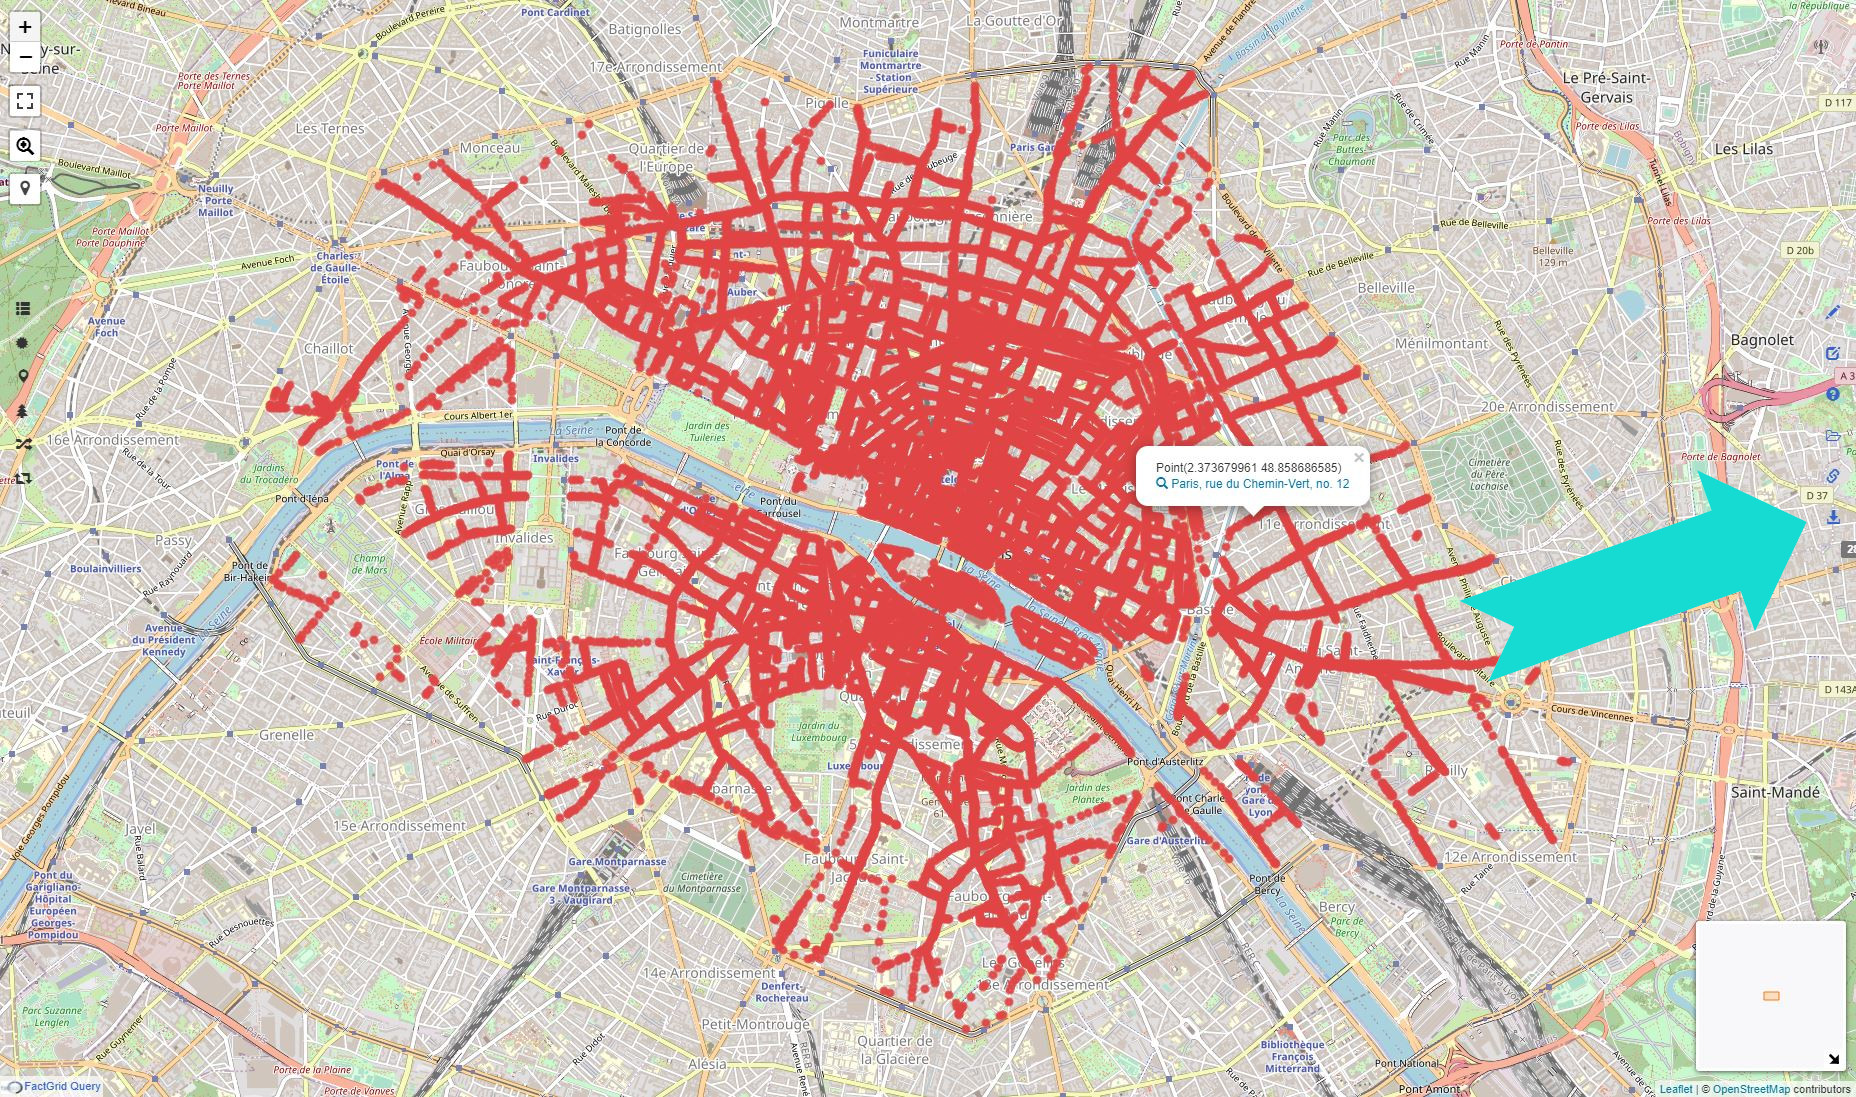
PARIS TO DOWNLOAD  comes with a double purpose: it is first designed to provide a dataset for historians to download with one simple click. Click the image below and a SPARQL query will bring the addresses of Paris c. 1830 onto a modern map.

Paris to download (click on the map) / link for the direct table download TSV formatted

On the right hand side you will be able to activate the menu that allows you to download the raw data behind this visualisation to your computer. TSV or CSV are the practical formats here. TSV (table separated) data can be copied and pasted into any spreadsheet. The download will come with the geographic coordinates and the address names, CC0-licensed and ready to use in any software environment of your choice…

…which might, however, not be the most interesting use to make of this data set. It should be far more attractive to create your own visualisations here on FactGrid with information you can put on any of the items underneath the visualisation. You will need an account to augment information on this data set and we are eager to open these accounts to all researchers working on historical Paris.

The collaborative project that we are offering here is still in its infancy. Its aim is to make resources on the history of Paris available to the general public, and more particularly historical data on Parisian roads and facilities. A lot of data exists on Paris but they are scattered and often difficult to access. FactGrid makes it possible to store, consult and retrieve them for free en masse and according to needs by simple queries.

PARIS TO DOWNLOAD  already provides a resource that will be of interest to all historians of 19th century Paris: a gazetteer giving the geocoded addresses of all buildings in Paris in the first half of the 19th century.

Some details below that might help to use the data set:

The history of house numbering in Paris

For a long time, urban addresses were identified by the names of houses and their signs (David Garrioch). Despite some attempts to number houses in modern times, it was not until after 1750 that real house numbering systems appeared in European and North American cities, and it was not until the 19th century that they became the norm for identifying urban addresses (Anton Tantner).

The house numbering errupted as a new element of rationality to order the city. As Anton Tantner and Reuben Rose-Redswood have shown, introducing numbers into the urban space is a ‘technique of power’ characteristic of the new governmentality that took hold in the second half of the 18th century. It was only later that the inhabitants themselves appropriated the new signage and made it a major tool for orientation and address location.

The history of house numbering in Paris is part of this general history of numbering (see Numérotation des immeubles de Paris). The first numbering system in Paris, introduced in 1779, was the work of a private contractor, Kreenfelt. This system is sequential by street and follows the course of a horseshoe. The doors, not the buildings, are numbered. In 1791 this first system was abandoned in favour of a system of house numbering by district (named section). In this system the numbers could be very large and the same street could have several identical numbers in case it belonged to several sections. Finally, because of these disadvantages, the system of 1791 was abandoned in 1805 and a new system was introduced on the initiative of the préfet Frochot, now inspired by the numbering system of Philadelphia

The 1805 numbering system

Frochot’s system is the one that it is still used in Paris today. It is sequential by street and of the even/odd type. The series of numbers in a street is made up of even numbers on the right side, and odd numbers on the left side. The right side is the one to the right-hand of the passer-by going up the street towards the Seine. If the street is parallel to the Seine, the right side is the one to the right-hand of the passer-by going up the street in the direction of the river course. The numbers are visibly inscribed on the facades of each house (document 1).

Document 1: No. 13, rue de la Bûcherie,  drawing by J.-A. Chauvet, coll. Musée Carnavalet

Although the 1805 system is still used in Paris, many streets were renumbered during the 19th century. The most important reform of Parisian numbering was carried out by the prefect Rambuteau in 1847. In addition, the incorporation of neighbouring communes in 1860 and the Hausmannian transformations considerably extended the house numbering compared to the initial state. Since the end of the 19th century, however, address numbering has changed little in Paris.

Today, the Parisian house numbering covers about 150,000 addresses, compared to about 28,000 in 1805.

Parisian directories of the 19th Century

House numbering facilitated the making of address books and directories (see a list in the wiki Geohistoricaldata). The most famous one is the Bottin, the directory published by Sébastien Bottin. Each year since 1819, Bottin published the addresses of the trades and those of the most notable inhabitants (see document 2)

Addresses of the boarding schools, Bottin 1825
Document 2: Bottin, 1825: addresses of boarding schools. Source: Gallica

In 1834 Guyot de Fère published a Statistique des lettres et des sciences and the following year a Statistique des Beaux-Arts which gave the addresses of Parisian writers and artists. Numerous other publications provided the addresses of shops, workshops, schools, associations, etc. In other words, we have easily accessible sources for mapping the economic, social and business life of the city in the 19th and 20th centuries, provided we can locate the address numbers.

How to locate an old Parisian address?

Finding the location of an address is now a breeze: just go to OnStreetMap, Google Maps, or any other web mapping platform. You can also easily download for free the dataset of the current 150,000 Parisian addresses on the site Data Paris. But what about addresses of the past? If old addresses cannot be located, directories are of no use to the historian. It is therefore not surprising that this type of source has been little used in historical works on Paris until now.

The present data set has taught me some of the intricacies of locating Parisian addresses of the past. I leave aside here the difficult question of the location of Parisian addresses before the end of the 18th century. Let us see how it would be possible to proceed from the creation of the first house numbering system in 1779. It is easy to understand that the only possible method is to geocode the address, i.e. to associate the address number of each house with its geographic coordinates, but it does’nt get us very far: how do we know the geographical coordinates of an address? That is the question.

The problem of the maps

The only possible answer is: having a map. We can use current maps. Especially OneStreetMap is of good value here, as it displays house numbers. For example,  no. 6 of Place des Vosges where Victor Hugo had a flat between 1832 and 1848  (now the Musée Victor Hugo) was already  no. 6 at that time. The same for no. 10, rue Monsieur-le-Prince, where Auguste Comte lived from 1841 to 1857 or for  no. 8, rue de Caumartin, where Stendhal wrote his famous novel The Charterhouse of Parma in 56 days in 1838. The address of Eugène Delacroix’s studio from 1844 to 1858 is still at the same address, no. 58, rue Notre-Dame-de-Lorette. etc.

The majority of the address numbers of the early nineteenth century has not changed. But there are many exceptions. For instance, Stendhal wrote his novel The Red and the Black at no. 71, rue de Richelieu, which is now no. 69 of the same street (the original building has been demolished). Géricault’s studio was at no. 25, rue des Martyrs, which is now the no. 23. etc. But there are worse cases. A lot of old streets of Paris have been destroyed, reduced in size or extensively redesigned. For instance,  no. 27, rue Notre-Dame-des-Champs, where Victor Hugo wrote his play Hernani in 1829, had disappeared with the opening of the Boulevard Raspail.

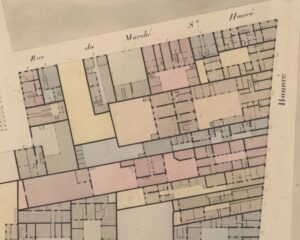
The examples show that using current maps remains an unreliable method of locating old Parisian addresses. To solve the problem, we would like to have georeferenced historic maps of Paris displaying house numbers. Obviously such maps do not exist ready-made, but they can be created from two old collections of maps based on the excellent topographical survey realized by Verniquet in 1790: the Atlas Vasserot drawn up between 1810 and 1836, and the Atlas Jacoubet published between 1827 and 1839. Both of them indicate the house numbers (see documents 3 and 4).

Plan Vasserot. Detail of a sheet
Document 3: Atlas Vasserot. Rue du Marché-Saint-Honoré
Plan Jacoubet. Detail of a sheet
Document 4: Atlas Jacoubet. Rue du Marché-Saint-Honoré

Georefencing and geocoding

The georeferencing of the Atlas Vasserot has been realized between 2006 and 2010 by the team ALPAGE (LAMOP, CNRS/Paris 1, resp. H. Noizet) and the result is available on the platform ALPAGE. A georeferencing of the Atlas Jacoubet has also be realized by the team SIGParis18-19  (EHESS), but the resulting georeferenced map is not yet published.

The next step is the geocoding of the addresses. The work has been done on the georeferenced Atlas Vasserot by A.-L. Bethe (ALPAGE) in 2010 and the data set (about 28000 addresses) is available on the platform ALPAGE, données Vasserot. The team SIGParis18-19 has used its georeferenced map of the Atlas Jacoubet (transferred to the Atlas Verniquet of 1790) to geocode the Parisian addresses of 1789 (about 23000 addresses). The methodoly is explained in an article with some applications (Anne Varet-Vitu, Mathieu Marraud, Éric Mermet, 2020), but the dataset is again not yet published. I would add that a wiki project Localisations parisiennes (1780-1810) was launched in 2017 by Dominique Waquet to make a street-by-street inventory of Parisian buildings during the  Revolution aiming at a future geocoding of the addresses following the numbering system of 1791, but so far only the addresses of the rue Saint-Honoré have been located.

The Parisian addresses on FactGrid

Each of the 28000 Parisian addresses on FactGrid  is a Q-item. The form of its label is  :
“Paris, street name, no. #”
and its description indicates the numbering system and the initial time (most often 1805). English, German and French labels and descriptions are available. You can also select these languages on the FactGrid viewer.

Each address has the following  linked data:
1. the street , 2. the quarter, 3. the city (Paris), 4. the numbering system, 5. the geographical coordinates (WGS84) with the parcel ID as qualifier and the reference to the dataset “Données Vasserot”; some items are additional linked data like the previous address at the same location.

Each street of Paris (for the period 1805-1850) is also a Q-item. See the example of the rue Saint-Honoré. The same for the quarters and the arrondissements (for the same period).

The dataset “Données Vasserot”

The project PARIS TO DOWNLOAD has put the dataset “Données Vasserot version 1 (2010, A.-L. Bethe), Alpage” on FactGrid (with the agreement of ALPAGE).

The dataset “Données Vasserot” is based on information collected  before the mid-1820s and does not include the addresses for streets opened after 1805. However, these addresses, for which the Atlas Vasserot is of no help, are in FactGrid.  Their geocoding is based on the Atlas Jacoubet combined with information coming both from the Dictionnaire administratif et historique des rues de Paris and from the Bottin of 1850 (this volume, unfortunately not yet available on the internet, contains a conversion table between the old address numbers and the numbers adopted after the 1847 reform of the house numbering). This geocoding is here work in progress and some streets and addresses are still missing.

For the moment, the Parisian addresses produced on FactGrid by PARIS TO DOWNLOAD are reliable for the period between 1805 and 1848. These data should be used with caution for the period after 1848, as the Rambuteau reform of the house numbering introduced many changes, even if they were mostly shifts of a few numbers. In addition, the incorporation of neighbouring communes in 1860 dramatically increased the number of streets and addresses in Paris. It would be very useful to undertake geocoding  all these addresses, but that is another task.

Querying addresses on FacGrid

All the Parisian addresses can be downloaded by using the FactGrid query service.

One of the advantages of the FactGrid repository is that it is possible to make a selection. Suppose you want only the addresses of the rue de la Harpe. You can get a map (don’t forget to launch the query) or a data table (don’t forget to launch the query).

You can select all the addresses of a quarter, for instance the addresses in the Quartier de l’Ecole-de-Médecine (don’t forget to launch the query), or all the addresses of an arrondissement, for instance all the addresses in the former 11e arrondissement (don’t forget to launch the query). You can also get the list of all the streets of Paris (between 1805 and 1850), etc.

If you have a data file with Parisian addresses (for instance the list of all Parisian physicians extracted from  the Bottin of the year 1825), you can download the 28000 geocoded addresses from FactGrid, match these addresses with the addresses of your file in order to collect the geographical coordinates and use your completed data file to create a map on your favourite GIS. OpenRefine makes the work still easier (an OpenRefine service will be available very soon on FactGrid).

However, the best option is to put your data file directly on FactGrid and to add a statement Address (P208) to each Q-item you have created, in order to benefit of all the power of the FactGrid database and query service. See, as a simple example, the eleven Parisian addresses of Auguste Comte.

As said in the beginning: The dataset is designed to work in any other software environment, but it is beyond that an invitation to aggregate information here on the site — on the address items and on the items of people and objects you are interested in and you would like to create and to interconnect within the data set. It’s free, open and collaborative.

Simply have an account and contribute!


Video presentation of 19 May 2022: